

Question: Statistic help needed! 1) HS Sophomore students organized a pep-rally raffle and 40 students from all years participated. The winners included: 10 freshmen, 15 sophomores,
Statistic help needed!
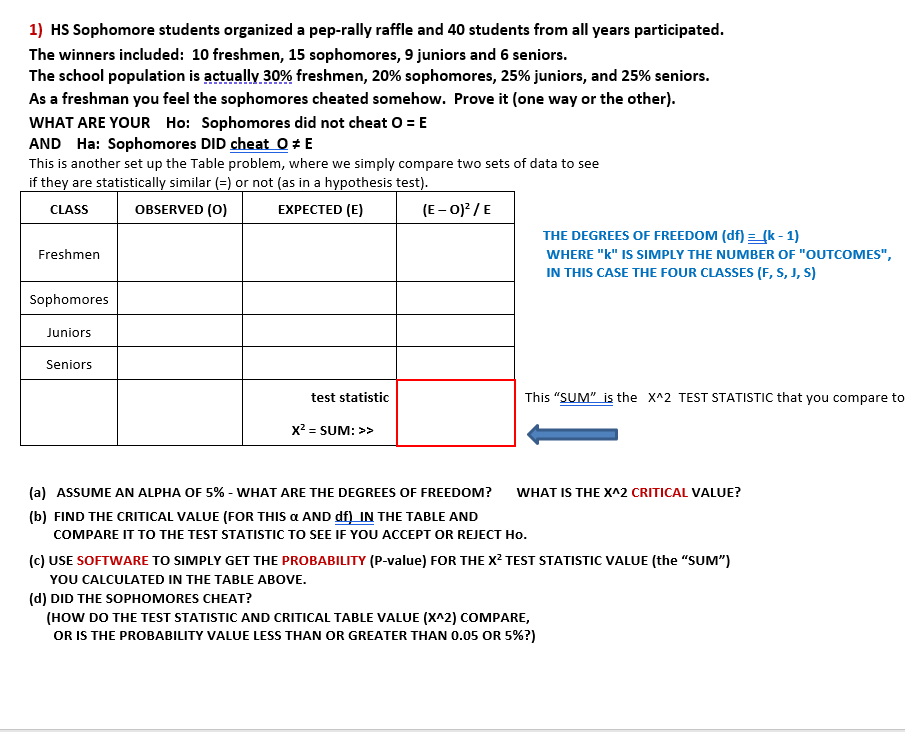
1) HS Sophomore students organized a pep-rally raffle and 40 students from all years participated. The winners included: 10 freshmen, 15 sophomores, 9 juniors and 6 seniors. The school population is actually 30% freshmen, 20% sophomores, 25% juniors, and 25% seniors. As a freshman you feel the sophomores cheated somehow. Prove it (one way or the other). WHAT ARE YOUR Ho: Sophomores did not cheat O = E AND Ha: Sophomores DID cheat O # E This is another set up the Table problem, where we simply compare two sets of data to see if they are statistically similar (=) or not (as in a hypothesis test). CLASS OBSERVED (O) EXPECTED (E) (E - 0) / E THE DEGREES OF FREEDOM (df) = (k - 1) Freshmen WHERE "k" IS SIMPLY THE NUMBER OF "OUTCOMES", IN THIS CASE THE FOUR CLASSES (F, S, J, S) Sophomores Juniors Seniors test statistic This "SUM" is the X^2 TEST STATISTIC that you compare to X2 = SUM: > > (a) ASSUME AN ALPHA OF 5% - WHAT ARE THE DEGREES OF FREEDOM? WHAT IS THE XA2 CRITICAL VALUE? (b) FIND THE CRITICAL VALUE (FOR THIS a AND df) IN THE TABLE AND COMPARE IT TO THE TEST STATISTIC TO SEE IF YOU ACCEPT OR REJECT HO. (c) USE SOFTWARE TO SIMPLY GET THE PROBABILITY (P-value) FOR THE X2 TEST STATISTIC VALUE (the "SUM") YOU CALCULATED IN THE TABLE ABOVE. (d) DID THE SOPHOMORES CHEAT? (HOW DO THE TEST STATISTIC AND CRITICAL TABLE VALUE (X^2) COMPARE, OR IS THE PROBABILITY VALUE LESS THAN OR GREATER THAN 0.05 OR 5%?)
Step by Step Solution
There are 3 Steps involved in it

Get step-by-step solutions from verified subject matter experts