Question: Statistical Analysis What can you figure out from a bunch of numbers? What do these statistics mean to a reader? How can you best display
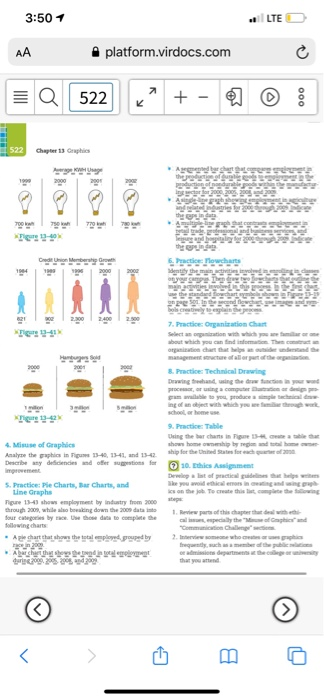
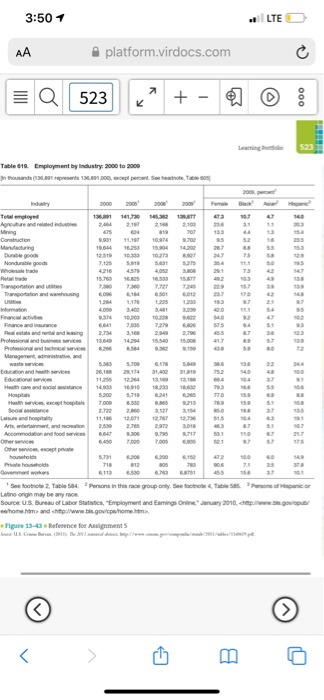
Statistical Analysis What can you figure out from a bunch of numbers? What do these statistics mean to a reader? How can you best display them? Instructions: Employment is an important issue as we consider the US economy. Where do you see opportunities for growth and change? On Page 523 of your textbook, you will find a table full of numbers concerning Employment in the USA over a 10 year span. What jobs increased in number? Which declined? For this assignment, read and complete Page 522, #5. However, do not create the segmented bar chart! You will 1. Fill out a Planning form for your reader, 2. Write a memo. This is an informative and persuasive memo. 3.Organize the memo using the ABC organization. See Correspondence Guideline 5: Use the 3Cs Strategy, p160 A: The purpose of your memo to me B: The four graphs C: Follow up
Technical writting
i was able to resolve it by myself
3:50 1 LTE AA platform.virdocs.com IIII Q 522 +- 1522 Chapter 13 Graphics Praw 2000 1900 2001 7 Owner 6. Practice owcharte 1904 2000 2000 621 2.900 2.400 7. Practice Organization Chart about which you can find in the management structure of all are the 8. Practice: Technical Drawing Drawing and using the town you want ing of an object with which you who work 9. Practice Table 4. Misuse of Graphics Analyse the paphics in Time 13-46 1941, and 15-4 for the third Describe wydecin and other for 10 thies Aliment Improvement Dewegint of practical shapes 5. Practice Pie Charts Charts, and Line Graphe is on the job. To create this list.come the wing Tigre 15-3 show employment by industry from 2000 pe through 2009, while being down the 2000 de 1. Review parts of this chapter four Categories by the date to complete the pecially the ind following charts A plechart that shows the total esployed ouped by frequently, where the Atsheet the systemet that you attend O B 3:50 1 LTE AA platform.virdocs.com EQ 523 + 000 523 Table 10. Employment by industry, 2000 to 2000 In thonda (prep percent Seeds 136,001 141,730 146.2 133 Construction ON 15.204 10 10:30 10273 416 18.703 16:53 SET 7.80 7.0 7.27 Transportation and housing 6.166.50 6.12 Ut 17:22:22 4.0 340 341 342 Francia active 6.370 7.72 Real estate and und 2.722.79 Dr. 13.640424 15:40 15.000 Management 4 NE PEEEEEEEEEEE e te cilet e E 5.79 Huule servem caps 7.000 Sood 3127 Land hospitality 11.10 12.0 12.0 12.79 Arts, entertainment, and at 250 2.75 2.872 3:01 Accommodation and food servi 8.647 2.200.79 717 35.0 22 5.7.3.2001 The 35 3 Se footnote 2. Table 4. Persons in this regroupony. See otros como Latine origin may be anyon Source U.S. Bureau of Labor Statistics, Employment and Earnings Onlineanuary 2010.com.br home and/www.bsgolpo homem Figure 13-43 Reference for Assignments www.US.C... www.camp B o 3:50 1 LTE AA platform.virdocs.com IIII Q 522 +- 1522 Chapter 13 Graphics Praw 2000 1900 2001 7 Owner 6. Practice owcharte 1904 2000 2000 621 2.900 2.400 7. Practice Organization Chart about which you can find in the management structure of all are the 8. Practice: Technical Drawing Drawing and using the town you want ing of an object with which you who work 9. Practice Table 4. Misuse of Graphics Analyse the paphics in Time 13-46 1941, and 15-4 for the third Describe wydecin and other for 10 thies Aliment Improvement Dewegint of practical shapes 5. Practice Pie Charts Charts, and Line Graphe is on the job. To create this list.come the wing Tigre 15-3 show employment by industry from 2000 pe through 2009, while being down the 2000 de 1. Review parts of this chapter four Categories by the date to complete the pecially the ind following charts A plechart that shows the total esployed ouped by frequently, where the Atsheet the systemet that you attend O B 3:50 1 LTE AA platform.virdocs.com EQ 523 + 000 523 Table 10. Employment by industry, 2000 to 2000 In thonda (prep percent Seeds 136,001 141,730 146.2 133 Construction ON 15.204 10 10:30 10273 416 18.703 16:53 SET 7.80 7.0 7.27 Transportation and housing 6.166.50 6.12 Ut 17:22:22 4.0 340 341 342 Francia active 6.370 7.72 Real estate and und 2.722.79 Dr. 13.640424 15:40 15.000 Management 4 NE PEEEEEEEEEEE e te cilet e E 5.79 Huule servem caps 7.000 Sood 3127 Land hospitality 11.10 12.0 12.0 12.79 Arts, entertainment, and at 250 2.75 2.872 3:01 Accommodation and food servi 8.647 2.200.79 717 35.0 22 5.7.3.2001 The 35 3 Se footnote 2. Table 4. Persons in this regroupony. See otros como Latine origin may be anyon Source U.S. Bureau of Labor Statistics, Employment and Earnings Onlineanuary 2010.com.br home and/www.bsgolpo homem Figure 13-43 Reference for Assignments www.US.C... www.camp B o