

Question: Statistical Conclusions What is the analysis and the conclusions, limitations of the test, and alternate explanations for the findings and potential areas for future exploration?
Statistical Conclusions
What is the analysis and the conclusions, limitations of the test, and alternate explanations for the findings and potential areas for future exploration?
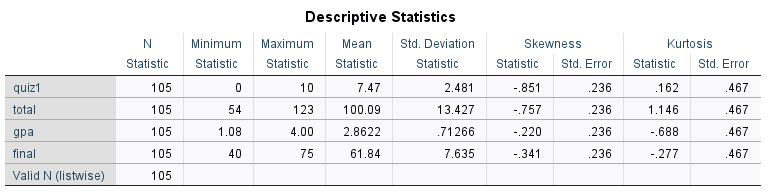
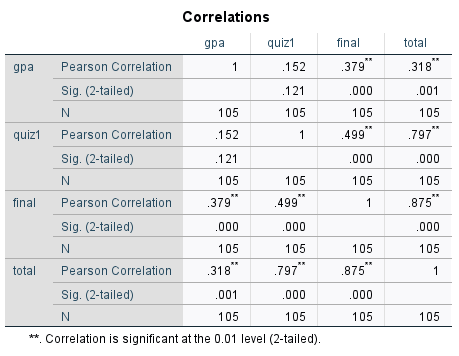
H? = There is no relationship between Quiz 1 (x) and the GPA(y).
H = There is a correlation between x and y.
Testing Assumptions


Descriptive Statistics N Minimum Maximum Mean Std. Deviation Skewness Kurtosis Statistic Statistic Statistic Statistic Statistic Statistic Std. Error Statistic Std. Error quiz1 105 0 10 7.47 2.481 -.851 .236 162 467 total 105 54 123 100.09 13.427 -.757 236 1.146 .467 gpa 105 1.08 4.00 2.8622 71266 -.220 .236 -.688 .467 final 105 40 75 61.84 7.635 -.341 .236 -.277 467 Valid N (listwise) 105Correlations gpa quiz1 final total gpa Pearson Correlation 152 379 318 Sig. (2-tailed) .121 000 001 N 105 105 105 105 quiz1 Pearson Correlation .152 499 797 Sig. (2-tailed) 121 000 000 N 105 105 105 105 final Pearson Correlation .379 499 875 Sig. (2-tailed) 000 000 000 N 105 105 105 105 total Pearson Correlation .318 797 875 Sig. (2-tailed) 001 000 000 N 105 105 105 105 ** Correlation is significant at the 0.01 level (2-tailed)
Step by Step Solution
There are 3 Steps involved in it

Get step-by-step solutions from verified subject matter experts