

Question: Statistical methods , answer all questions Study the table below and answer questions that follow:- 1981 340 am {a} it] Using lcm In represent SDI]
Statistical methods , answer all questions
![questions that follow:- 1981 340 am {a} it] Using lcm In represent](https://dsd5zvtm8ll6.cloudfront.net/si.experts.images/questions/2024/09/66ef0b707c56c_06466ef0b705980e.jpg)
![SDI] tons. draw a compound bar graph to represent the data. {ii}](https://dsd5zvtm8ll6.cloudfront.net/si.experts.images/questions/2024/09/66ef0b7102a84_06466ef0b70d7af1.jpg)
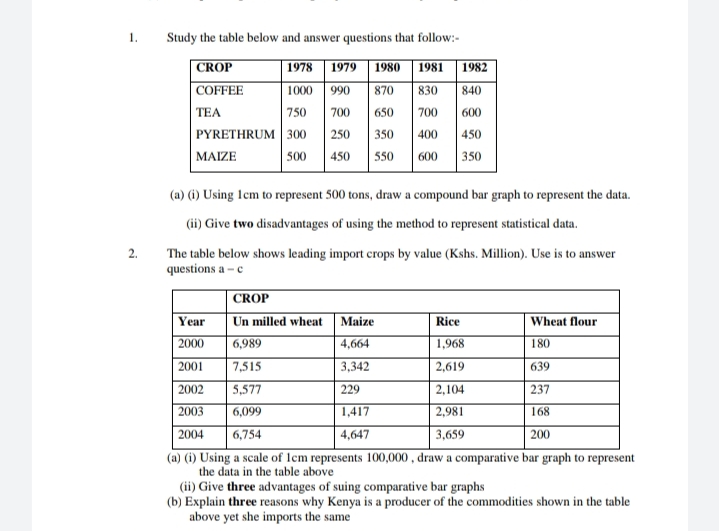
Study the table below and answer questions that follow:- 1981 340 am {a} it] Using lcm In represent SDI] tons. draw a compound bar graph to represent the data. {ii} llliive two disadvantages of using the method to represent statistical data. The table below shows leading import crops '63 value thhs. Million}. Use is to answer questions a - c - ell II. vs t Ie eat r -_ 6.939 4.664 I .963 mi) W___ mwmn mmmm mm\" \"mm {a} {it Using a scale of 1cm represents [60.660 .dratv a comparative bar graph to represent the data in the table above iii] Give three advantages of suing comparative bar graphs {h} Explain three reasons why Kenya is a producer of the commodities shown in the table above yet she imports the same w_m u___ w___ m__ ___ u} ii Using a vertical scale of I centimeter to represent [Ilium units. dravtr a compound hut graph to represent the above given data 4. Study the gure below and use it to answer question ti. The figure depicts proportional divided circles showing the extend of network coverage in Kenya between 2m? and III}? ' met? a] H State four deductions that can be made {torn the above representation iHStute iJII-ee advantages of using proportional circles in repoeeenting duta a) i) State four deductions that can be made from the above representation in)State three advantages of using proportional circles in representing data 5. The table below shows four principal crops produced in Kenya in the years 2000 and 2001. Use it to answer questions. CROP AMOUNT IN METRIC TONS YEAR 2000 2001 Wheat 70.000 13,000 Maize 200,000 370,000 Coffee 98,000 55,000 Tea 240,000 295.00 (a) (i) Using a radius of 5 cm, draw a pie chart to represent crop production in the year 2000. (ii) State two advantages of using pie charts. (b) Calculate the percentage increase in wheat production between the years 2000 and 2001
Step by Step Solution
There are 3 Steps involved in it

Get step-by-step solutions from verified subject matter experts