

Question: Statistical Problems Question 3 of 13 A study was conducted in order to compare the effectiveness of different types of automotive oil and the amount
Statistical Problems
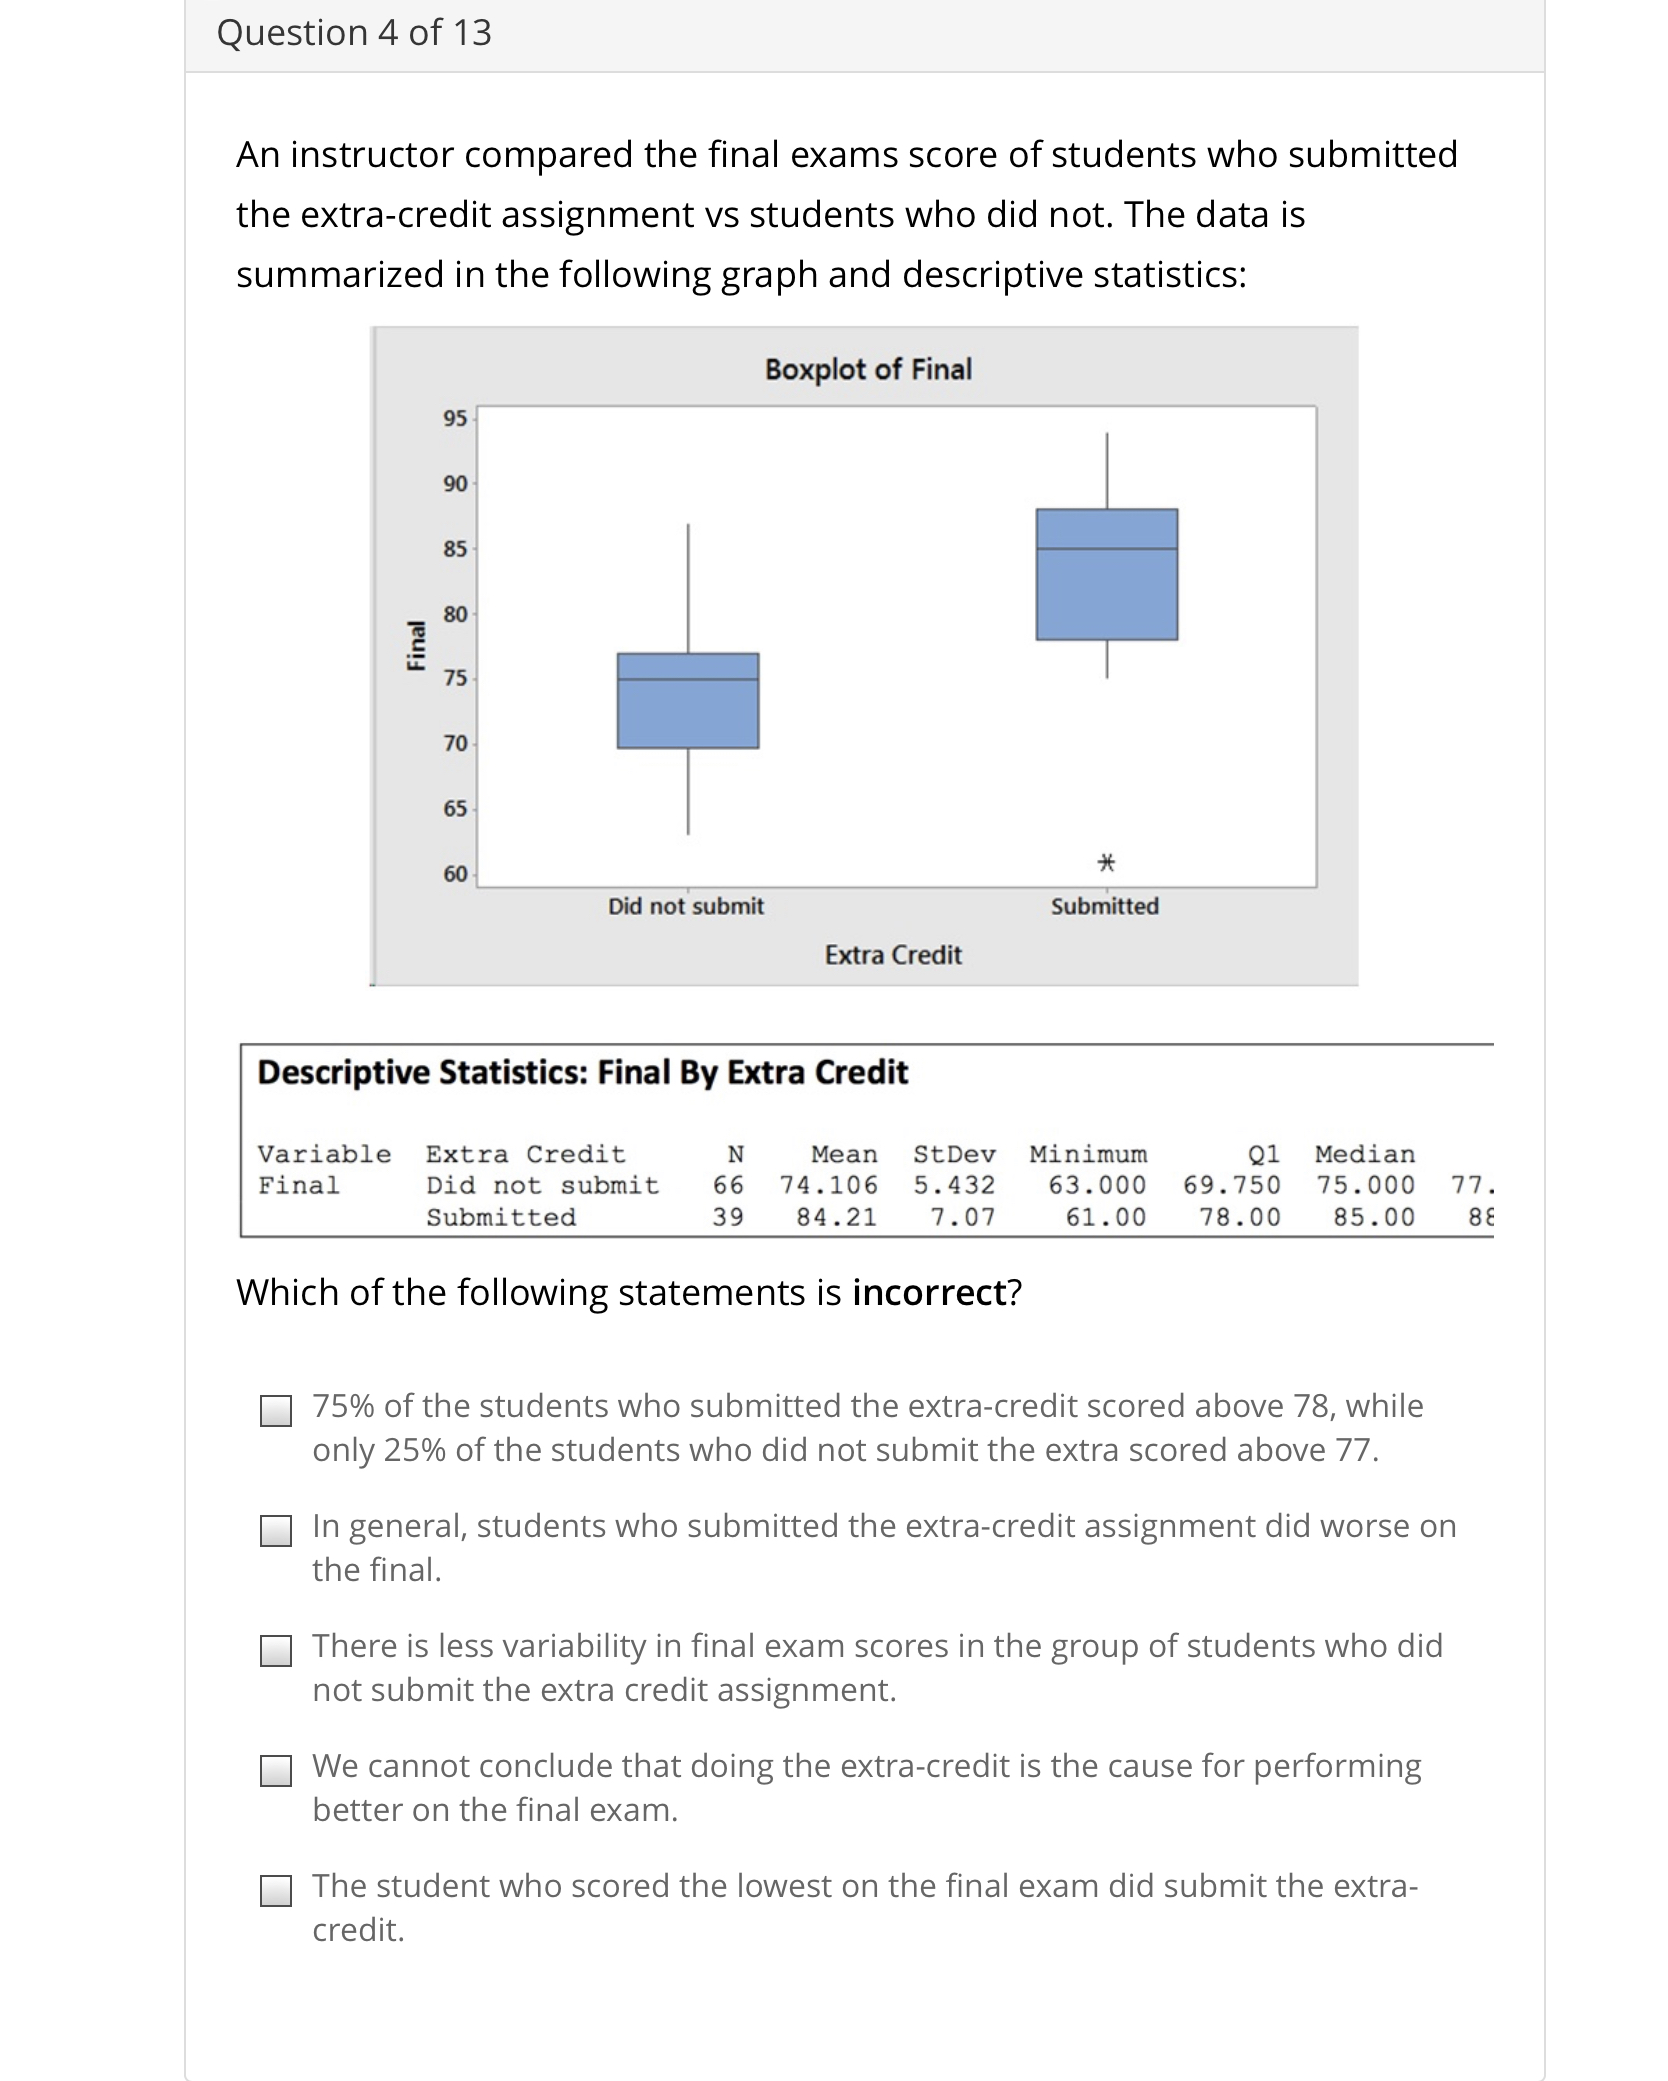
Question 3 of 13 A study was conducted in order to compare the effectiveness of different types of automotive oil and the amount of oil left after driving 30,000 miles in a Chevrolet Impala. The researchers tested the four brands of oil (for each brand of oil they tested 30 cars) and measured how much oil was left in the vehicle (in ounces) for each car. The collected data would be best displayed using: :| a histogram :| side-by-side boxplots :| a pie-chart :| a two-way table :| a scatterplot Question 4 of 13 An instructor compared the final exams score of students who submitted the extra-credit assignment vs students who did not. The data is summarized in the following graph and descriptive statistics: Boxplot of Final 95 90 85 .2 so I 75 70 65 60 it Did not submit Submitted ' ExtraCredlt Descriptive Statistics: Final By Extra Credit Variable Extra Credit N Mean StDev Minimum 01 Median Final Did not submit 66 74.106 5.432 63.000 69.750 75.000 77. Submitted 39 84.21 7.07 61.00 78.00 85.00 BE Which ofthe following statements is incorrect? :| 75% of the students who submitted the extra-credit scored above 78, while only 25% of the students who did not submit the extra scored above 77. :| In general, students who submitted the extra-credit assignment did worse on the final. :| There is less variability in final exam scores in the group of students who did not submit the extra credit assignment. :| We cannot conclude that doing the extra-credit is the cause for performing better on the final exam. :| The student who scored the lowest on the final exam did submit the extra- credit. Question 1 of 13 A sociological researcher investigated the relationship between the number of messages an individual sends in a dating app and the average number of dates that individual goes on in a six month period. Data was collected from 75 colleges across the U.S. and the collected data would be best displayed using: :| side-by-side boxplots :| a histogram :| a pie-chart :| a two-way table :| a scatterplot Question 2 of 13 A social scientist, studying anger and health outcomes, records what type of anger patterns a person has (instrumental anger, hostile/aggressive anger, or passive/repressed anger) and records whether each person has heart problems or gastro-intestinal problems, for 300 trials.The collected data would be best displayed using: :| a two-way table :| a scatterplot :| a histogram :| a pie-chart :| side-by-side boxplots
Step by Step Solution
There are 3 Steps involved in it

Get step-by-step solutions from verified subject matter experts