

Question: Statistical Process Control Assignment: An organization specializes in the farming and distribution of Norland potatoes, which were developed at North Dakota State University in 1
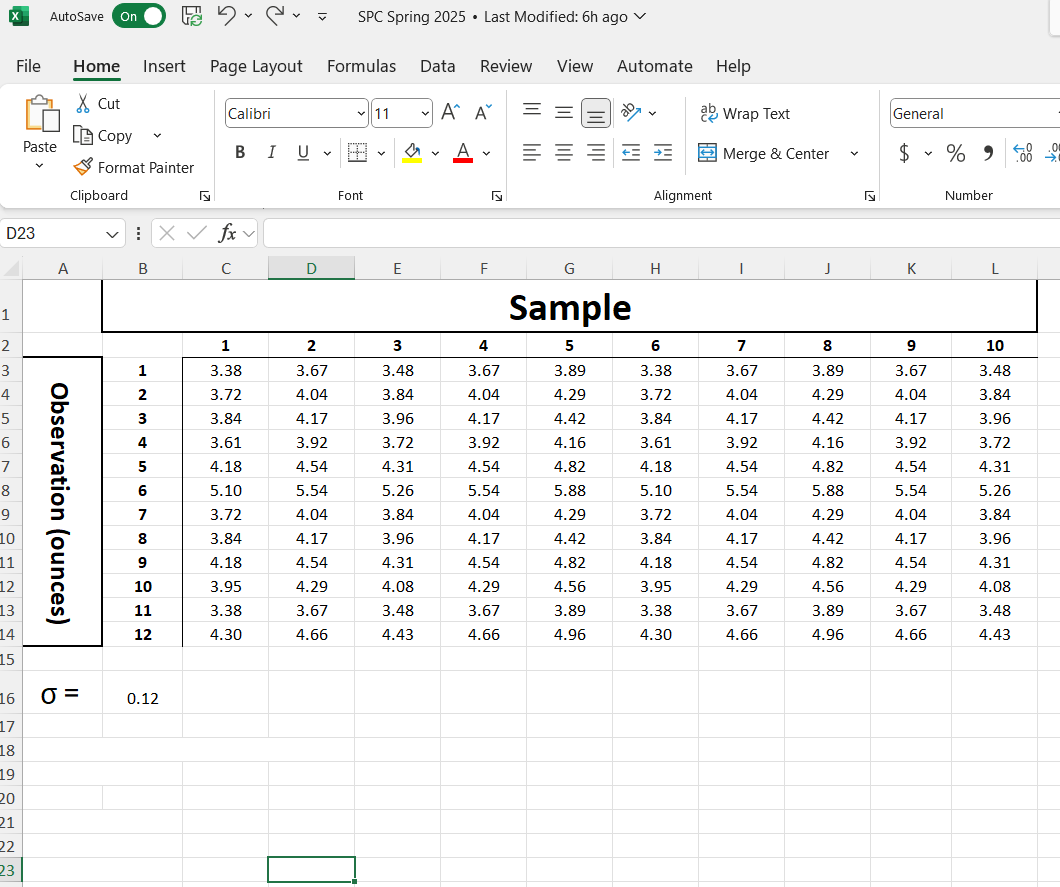
Statistical Process Control Assignment: An organization specializes in the farming and distribution of Norland potatoes, which were developed at North Dakota State University in to stores throughout the country. The organization has a specific fertilizer and maturation schedule to ensure that the potatoes are within a specific weight range at the time of packaging. Specifically, the organization is interested in evaluating the prevalent process dispersion. In order to check whether the aforementioned fertilizer and maturation schedule is achieving the organizations goals, SPC has been implemented. Assignment: Use the uploaded picture of the MS Excel worksheet of Sample Weights to create an Excel file. Create a control chart in MS Excel that includes: UCL, LCL Target and sample statistics to be compared to the UCL and LCL Formulas must be included in the MS Excel worksheet! Apply conditional formatting to the appropriate sample statistics to indicate their status. Conditional Formatting: In Control Green Fill with Dark Green Text Out of Control Light Red Fill with Dark Red Text Is the process deemed in or out of control? Provide specific evidence to support your position. begintabularccccccccccccc
hline & A & B & C & D & E & F & G & H & I & J & K & L
hline & & multicolumncSample
hline & & & & & & & & & & & &
hline & multirow & & & & & & & & & & &
hline & & & & & & & & & & & &
hline & & & & & & & & & & & &
hline & & & & & & & & & & & &
hline & & & & & & & & & & & &
hline & & & & & & & & & & & &
hline & & & & & & & & & & & &
hline & & & & & & & & & & & &
hline & & & & & & & & & & & &
hline & & & & & & & & & & & &
hline & & & & & & & & & & & &
hline & & & & & & & & & & & &
hline & & & & & & & & & & & &
hline & sigma & & & & & & & & & & &
hline
endtabular
Step by Step Solution
There are 3 Steps involved in it
1 Expert Approved Answer
Step: 1 Unlock

Question Has Been Solved by an Expert!
Get step-by-step solutions from verified subject matter experts
Step: 2 Unlock
Step: 3 Unlock