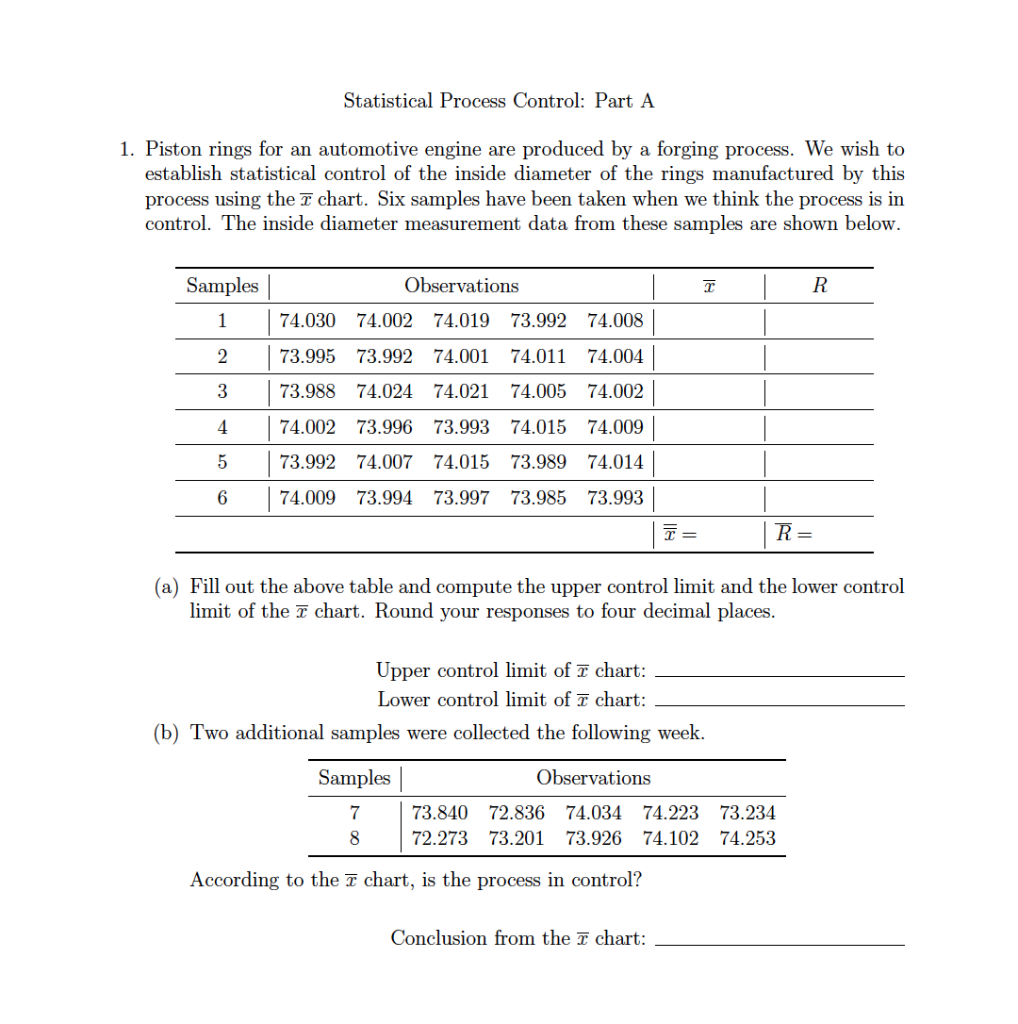
Question: Statistical Process Control: Part A 1. Piston rings for an automotive engine are produced by a forging process. We wish to establish statistical control of

Statistical Process Control: Part A 1. Piston

Statistical Process Control: Part A 1. Piston rings for an automotive engine are produced by a forging process. We wish to establish statistical control of the inside diameter of the rings manufactured by this process using the chart. Six samples have been taken when we think the process is in control. The inside diameter measurement data from these samples are shown below. Samples Observations T R 1 74.030 74.002 74.019 73.992 74.008 2 73.995 73.992 74.001 74.011 74.004 3 73.988 74.024 74.021 74.005 74.002 4 74.002 73.996 73.993 74.015 74.009 5 73.992 74.007 74.015 73.989 74.014 6 74.00973.994 73.997 73.985 73.993 = R= (a) Fill out the above table and compute the upper control limit and the lower control limit of the 7 chart. Round your responses to four decimal places. Upper control limit of chart: Lower control limit of chart: (b) Two additional samples were collected the following week. Samples Observations 7 8 73.840 72.836 74.034 74.223 73.234 72.273 73.201 73.926 74.102 74.253 According to the chart, is the process in control? Conclusion from the T chart

Step by Step Solution

There are 3 Steps involved in it

1 Expert Approved Answer
Step: 1 Unlock blur-text-image
Question Has Been Solved by an Expert!

Get step-by-step solutions from verified subject matter experts

Step: 2 Unlock
Step: 3 Unlock

Students Have Also Explored These Related General Management Questions!