

Question: statistical quality control Draw the control chart for the following data. Each 100m2 is an inspection unit. Is the process under control
statistical quality control 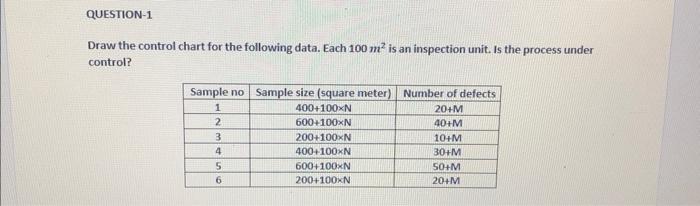
Draw the control chart for the following data. Each 100m2 is an inspection unit. Is the process under control
Step by Step Solution
There are 3 Steps involved in it
1 Expert Approved Answer
Step: 1 Unlock

Question Has Been Solved by an Expert!
Get step-by-step solutions from verified subject matter experts
Step: 2 Unlock
Step: 3 Unlock