

Question: STATISTICAL Run the code cell below to get a preview of the Oscar for Best Actress data set. 1. What are the variables in the
STATISTICAL
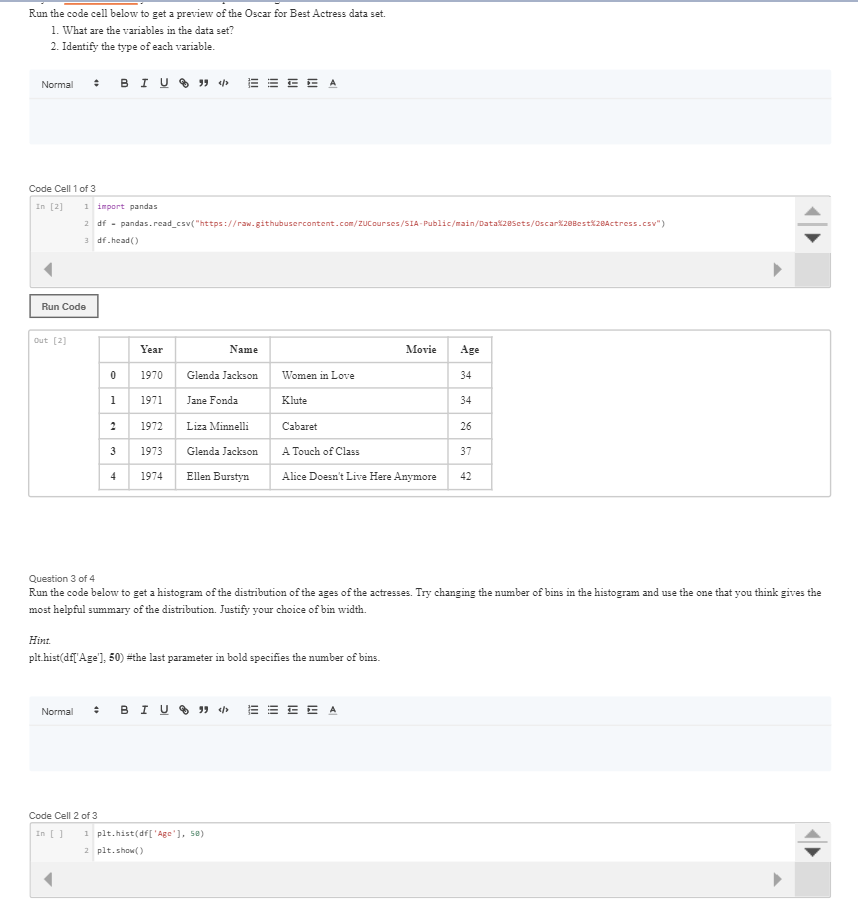
Run the code cell below to get a preview of the Oscar for Best Actress data set. 1. What are the variables in the data set? 2. Identify the type of each variable. Normal*BIU8994: Code Cell 1 of 3 \begin{tabular}{|ll|l} \hline In [2] & 1 & import pandas \\ & 2 & df - pandas.read_csv("https://raw. githubusercontent.com/zucourses/SIA-Pub1ic/main/DataK2escts/Oscar\%2eBestKzeactress _csv") \\ & 3 & df.head() \end{tabular} out [2] Queation 3 of 4 Run the code below to get a histogram of the distribution of the ages of the actresses. Try changing the number of bins in the histogram and use the one that you think gives the most helpful summary of the distribution. Justify your choice of bin width. Hint. plt hist(df['Age'], 50) =the last parameter in bold specifies the number of bins
Step by Step Solution
There are 3 Steps involved in it

Get step-by-step solutions from verified subject matter experts