

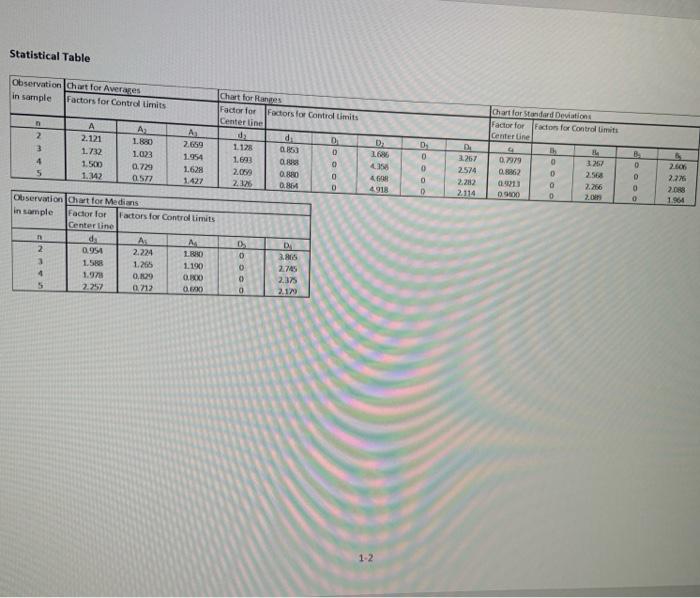
Question: Statistical Table 0 D 16 415 4 4918 Observation Chart for Averages Chart for Rames in sample Factors for Control Limits Factor for Factors for
Step by Step Solution
There are 3 Steps involved in it
1 Expert Approved Answer
Step: 1 Unlock

Question Has Been Solved by an Expert!
Get step-by-step solutions from verified subject matter experts
Step: 2 Unlock
Step: 3 Unlock