

Question: Statistician Francis Anscombe developed 4 data sets that demonstrate the importance of graphing data in addition to computing summary statistics such as the mean and
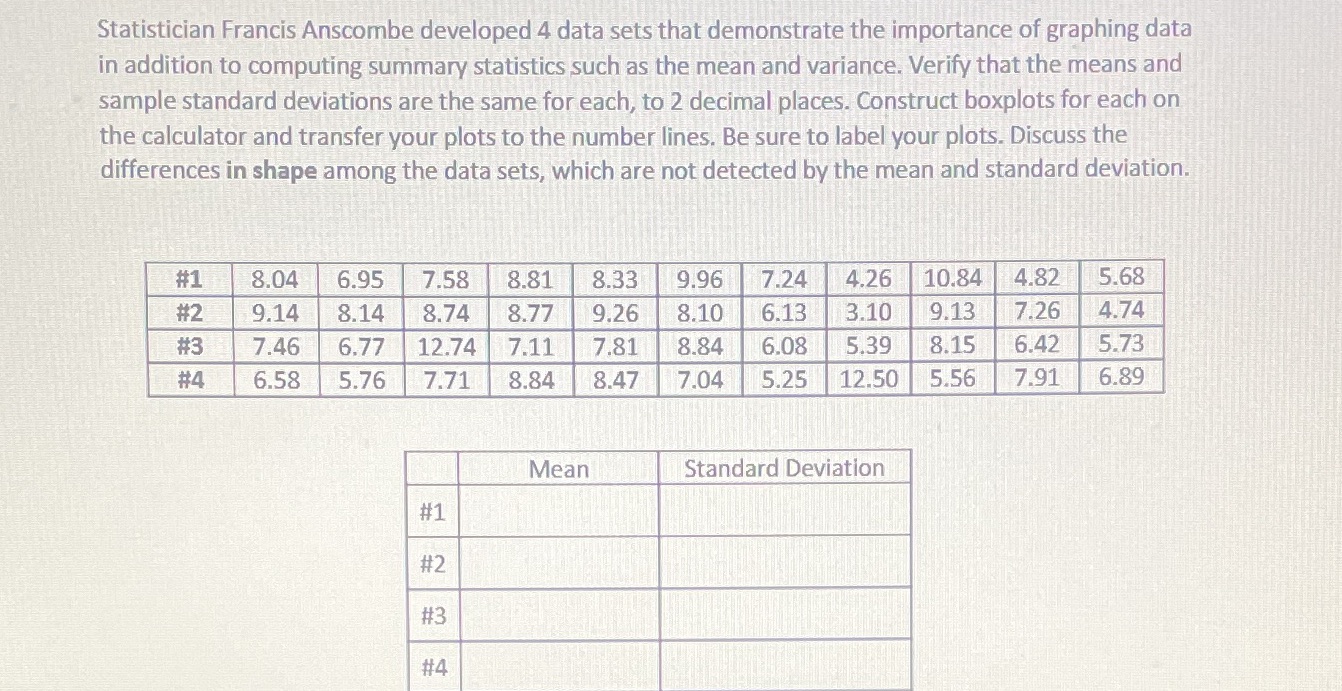
Statistician Francis Anscombe developed 4 data sets that demonstrate the importance of graphing data in addition to computing summary statistics such as the mean and variance. Verify that the means and sample standard deviations are the same for each, to 2 decimal places. Construct boxplots for each on the calculator and transfer your plots to the number lines. Be sure to label your plots. Discuss the differences in shape among the data sets, which are not detected by the mean and standard deviation. #1 8.04 6.95 7.58 8.81 8.33 9.96 7.24 4.26 10.84 4.82 5.68 #2 9.14 8.14 8.74 8.77 9.26 8.10 6.13 3.10 9.13 7.26 4.74 #3 7.46 6.77 12.74 7.11 7.81 8.84 6.08 5.39 8.15 6.42 5.73 #4 6.58 5.76 7.71 8.84 8.47 7.04 5.25 12.50 5.56 7.91 6.89 Mean Standard Deviation #1 #2 #3 #4
Step by Step Solution
There are 3 Steps involved in it

Get step-by-step solutions from verified subject matter experts