

Question: Anscombes quartet: Statistician Francis Anscombe developed four data sets that demonstrate the importance of graphing data in addition to computing the correlation and least-squares line.
Anscombe’s quartet: Statistician Francis Anscombe developed four data sets that demonstrate the importance of graphing data in addition to computing the correlation and least-squares line. Following are the data sets. Verify that the correlations and least-squares lines are the same for each, to two decimal places.
Construct scatterplots for each, and discuss the differences among the data sets, which are not detected by the correlation or least-squares regression line.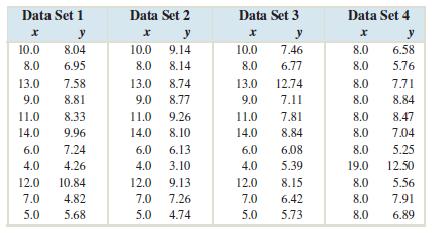
Data Set 1 Data Set 2 Data Set 3 Data Set 4 x y x y x y x y 10.0 8.04 10.0 9.14 10.0 7.46 8.0 6.58 8.0 6.95 8.0 8.14 8.0 6.77 8.0 5.76 13.0 7.58 13.0 8.74 13.0 12.74 8.0 7.71 9.0 8.81 9.0 8.77 9.0 7.11 8.0 8.84 11.0 8.33 11.0 9.26 11.0 7.81 8.0 8.47 14.0 9.96 14.0 8.10 14.0 8.84 8.0 7.04 6.0 7.24 6.0 6.13 6.0 6.08 8.0 5.25 4.0 4.26 4.0 3.10 4.0 5.39 19.0 12.50 12.0 10.84 12.0 9.13 12.0 8.15 8.0 5.56 7.0 50 4.82 7.0 7.26 7.0 6.42 8.0 7.91 5.0 5.68 5.0 4.74 5.0 5.73 8.0 6.89
Step by Step Solution
There are 3 Steps involved in it

Get step-by-step solutions from verified subject matter experts