

Question: Statistics 8 0.35- 0.3 0.25 0.2- 0.15 0.1- 0.05 0 1 2 3 4 5 6 7 8 number of successes Q Use the above
Statistics
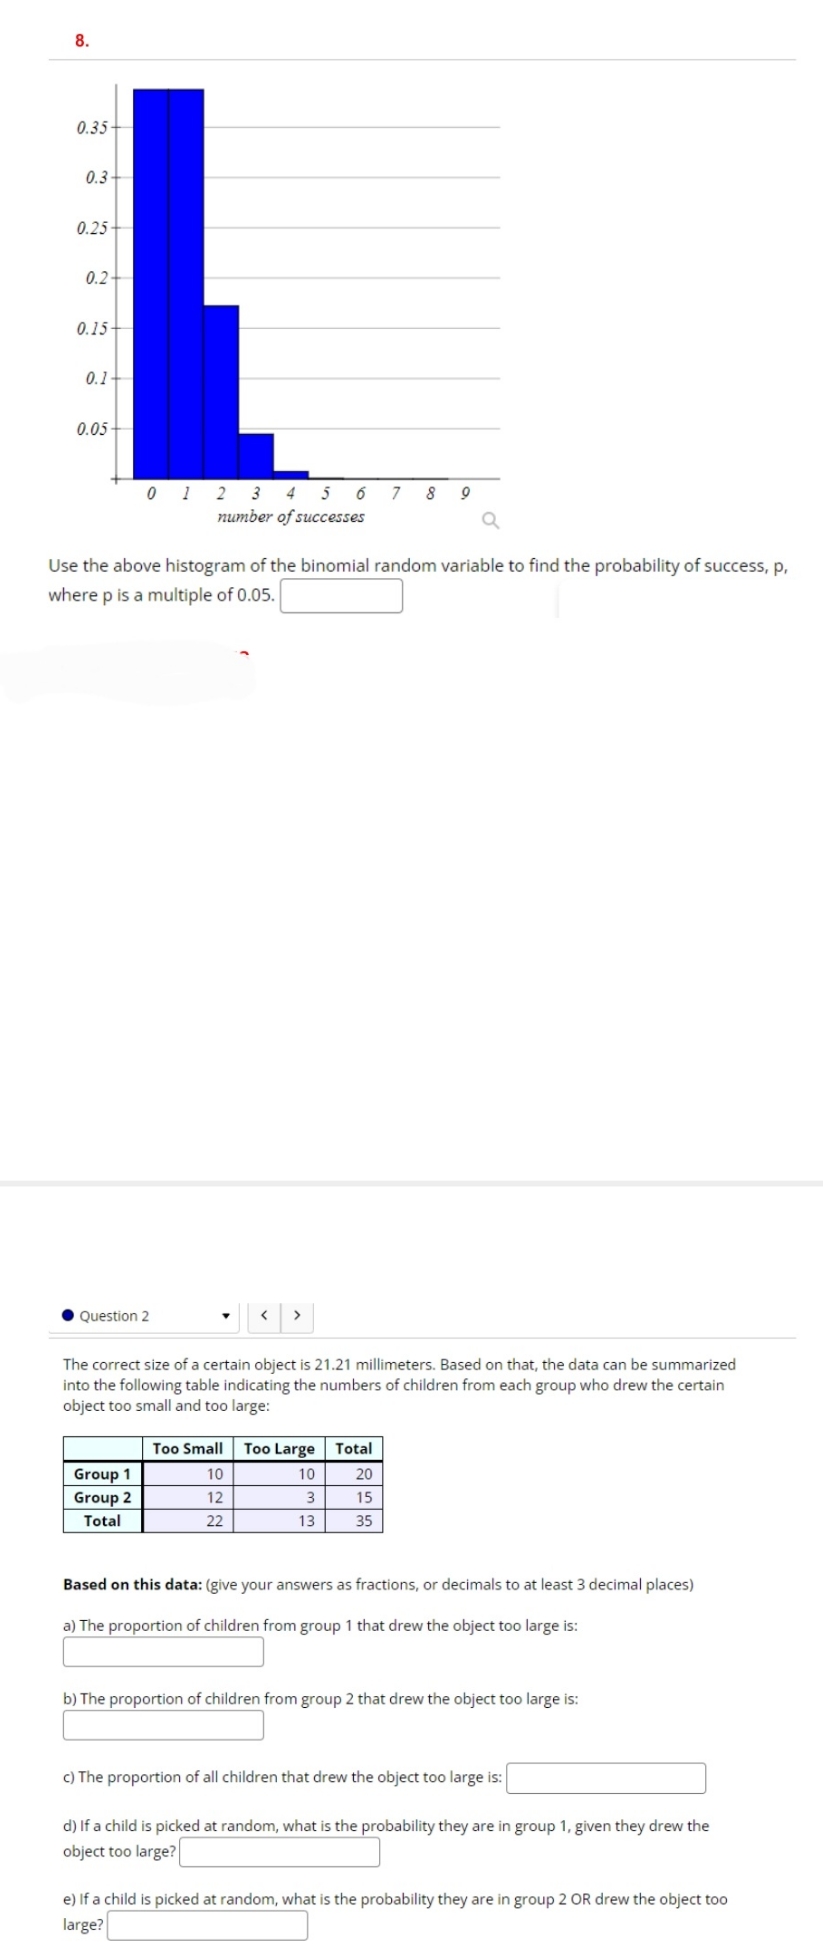
8 0.35- 0.3 0.25 0.2- 0.15 0.1- 0.05 0 1 2 3 4 5 6 7 8 number of successes Q Use the above histogram of the binomial random variable to find the probability of success, p, where p is a multiple of 0.05. Question 2 The correct size of a certain object is 21.21 millimeters. Based on that, the data can be summarized into the following table indicating the numbers of children from each group who drew the certain object too small and too large: Too Small Too Large Total Group 1 10 10 20 Group 2 12 3 15 Total 22 13 35 Based on this data: (give your answers as fractions, or decimals to at least 3 decimal places) a) The proportion of children from group 1 that drew the object too large is: b) The proportion of children from group 2 that drew the object too large is: c) The proportion of all children that drew the object too large is: d) If a child is picked at random, what is the probability they are in group 1, given they drew the object too large? e) If a child is picked at random, what is the probability they are in group 2 OR drew the object too large
Step by Step Solution
There are 3 Steps involved in it

Get step-by-step solutions from verified subject matter experts