

Question: A WSU student was interested in analyzing the time it takes the CUE Bus to complete her commute from the Vienna Metro to WSU.She collected
A WSU student was interested in analyzing the time it takes the CUE Bus to complete her commute from the Vienna Metro to WSU.She collected data for 600 trips she took during her tenure at WSU.
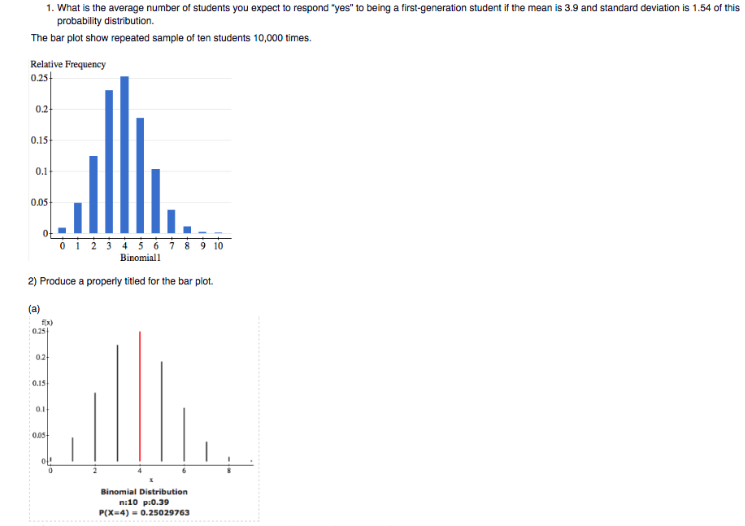
1. What is the average number of students you expect to respond "yes" to being a first-generation student if the mean is 3.9 and standard deviation is 1.54 of this probability distribution. The bar plot show repeated sample of ten students 10,000 times. Relative Frequency 0.25 0.2 0.15 0.1 0.05 0 1 2 3 4 5 6 7 8 9 10 Binomiall 2) Produce a properly titled for the bar plot. (a) :035 02 0.15 Binomial Distribution m:10 p:0.39 P(X-4) = 0.25029763
Step by Step Solution
There are 3 Steps involved in it

Get step-by-step solutions from verified subject matter experts