

Question: statistics 8.1.41 Here's a plot showing the interest rate on a 3-month bond from 1950 to 1980, and a regression model fit to the relationship
statistics
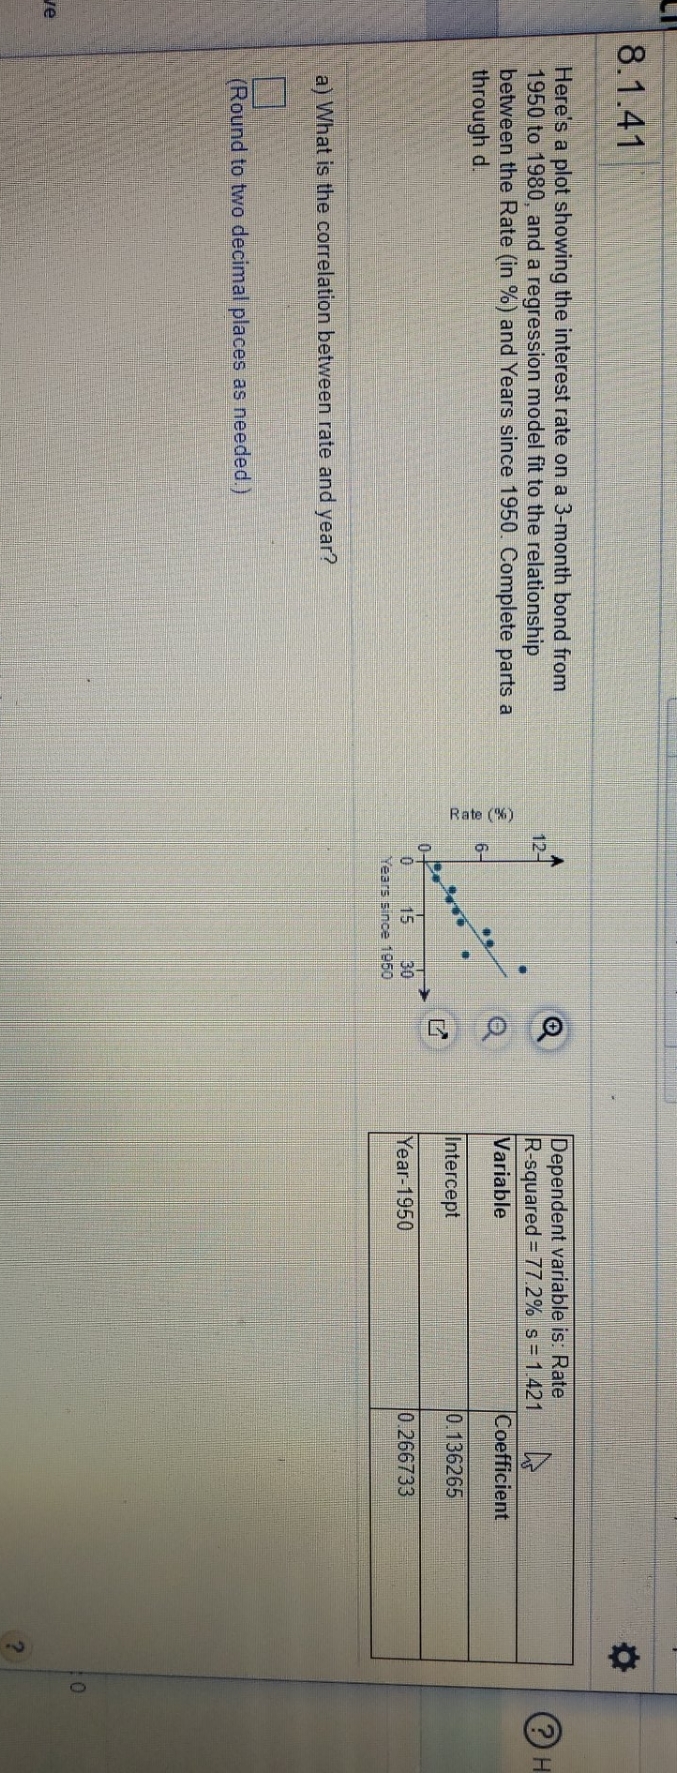
8.1.41 Here's a plot showing the interest rate on a 3-month bond from 1950 to 1980, and a regression model fit to the relationship N Dependent variable is: Rate R-squared =77.2% s =1.421 between the Rate ( in %) and Years since 1950. Complete parts a Variable Coefficient through d. Rate ('%) Intercept 0.136265 Year-1950 0.266733 Years since 1950 a) What is the correlation between rate and year? (Round to two decimal places as needed.)
Step by Step Solution
There are 3 Steps involved in it
1 Expert Approved Answer
Step: 1 Unlock

Question Has Been Solved by an Expert!
Get step-by-step solutions from verified subject matter experts
Step: 2 Unlock
Step: 3 Unlock