

Question: Statistics and Probability Here is a bivariate data set In which you believe to be the response variable. Make a scatter plot of this data.
Statistics and Probability
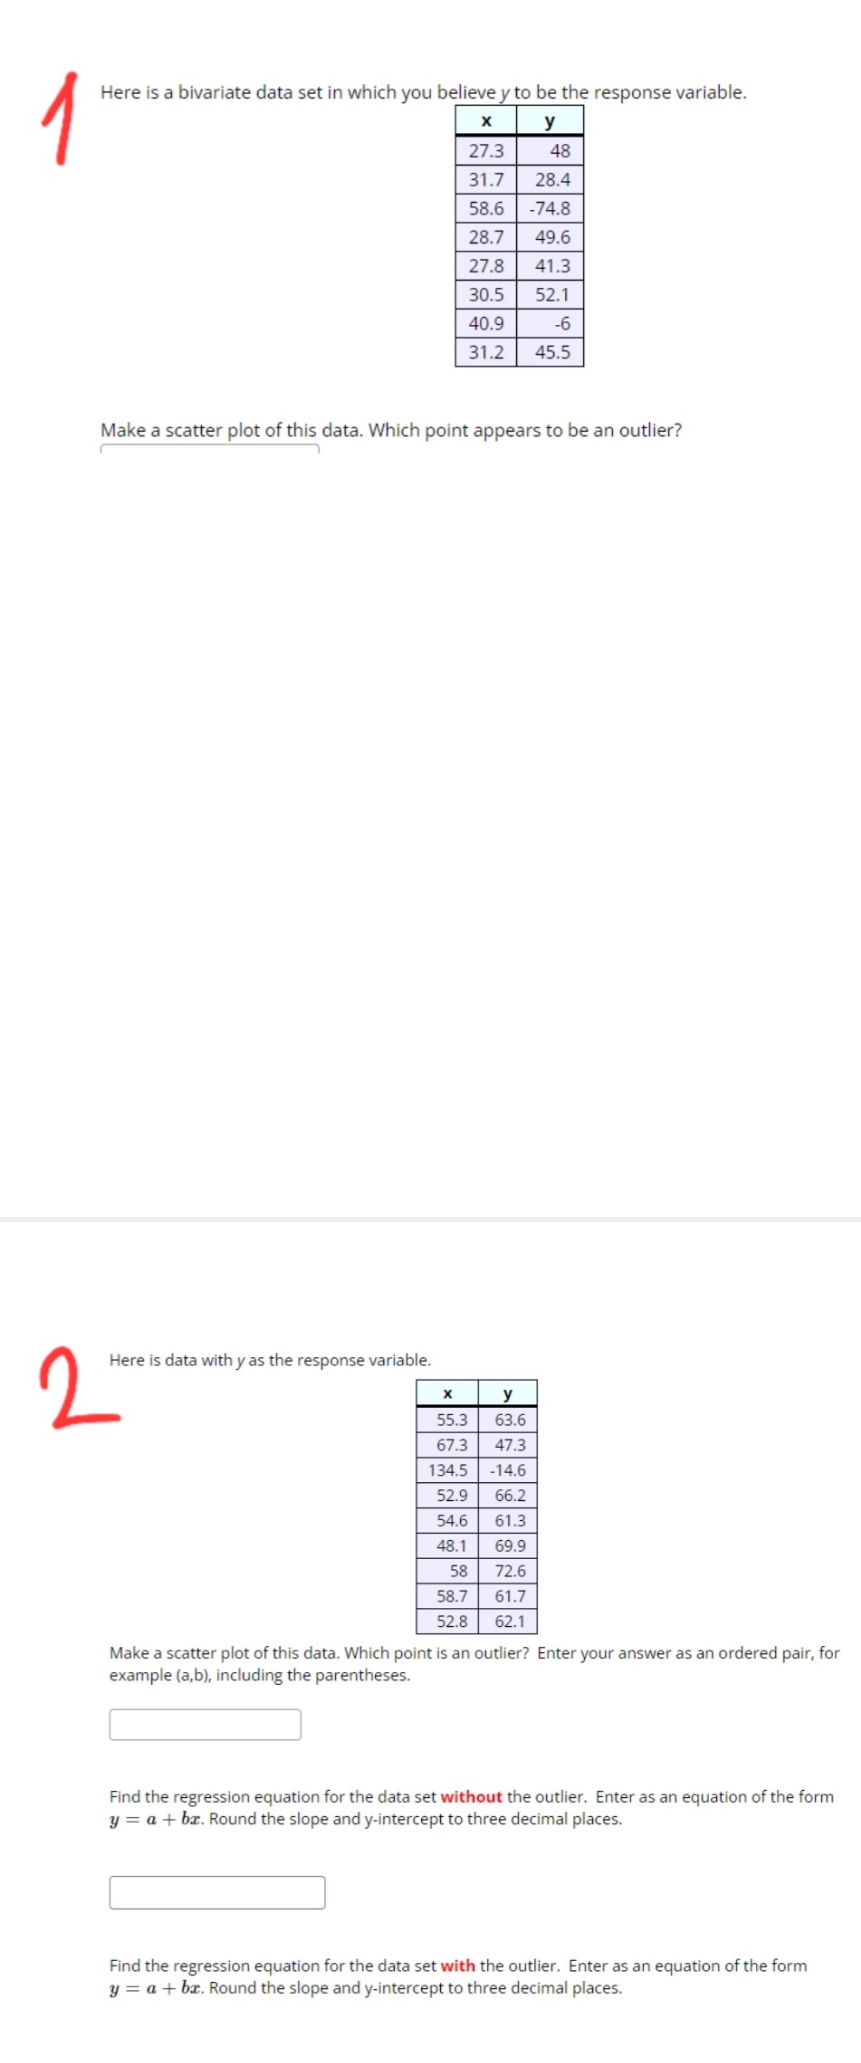
Here is a bivariate data set In which you believe to be the response variable. Make a scatter plot of this data. Which point appears to be an outlier? {1 Here is data with y as the response variable. I.\" -m Make a scatter plot of this data. Which point is an outlier? Enter your answer as an ordered pair. for example (ab). including the parentheses. :1 Find the regression equation for the data set without the outlier. Enter as an equation of the form y = a + bar. Round the slope and yintertept to three decimal places. |:l Find the regression equation for the data set with the outlier. Enter as an equation of the form y = a + 6:. Round the slope and yIntercept to three decimal places
Step by Step Solution
There are 3 Steps involved in it

Get step-by-step solutions from verified subject matter experts