Question: Statistics and Probability Question 1: Consider the point (-6, 0) in the rectangular co-ordinate system (Cartesian plane). Which picture below represents this point? Select one:
Statistics and Probability
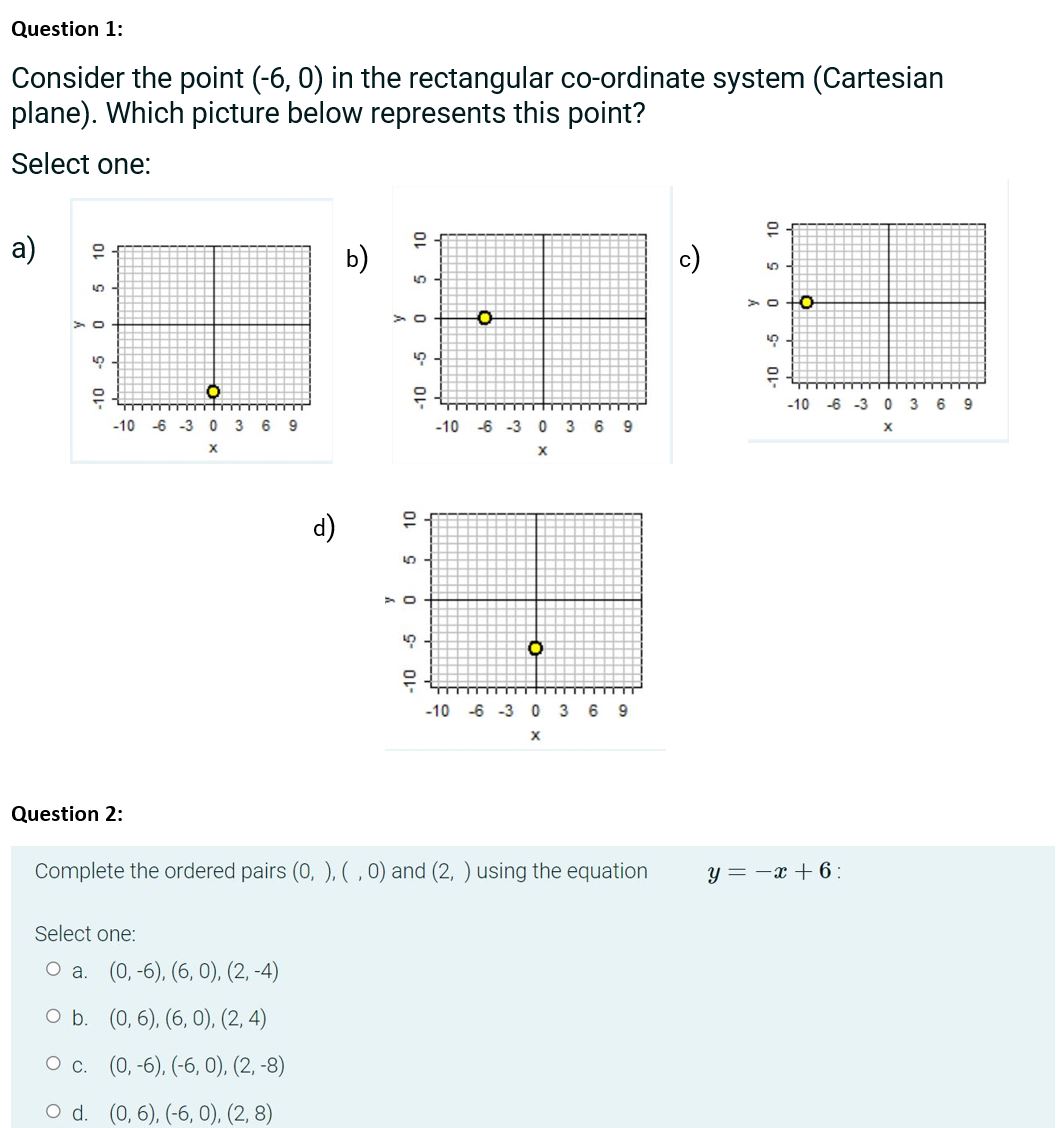
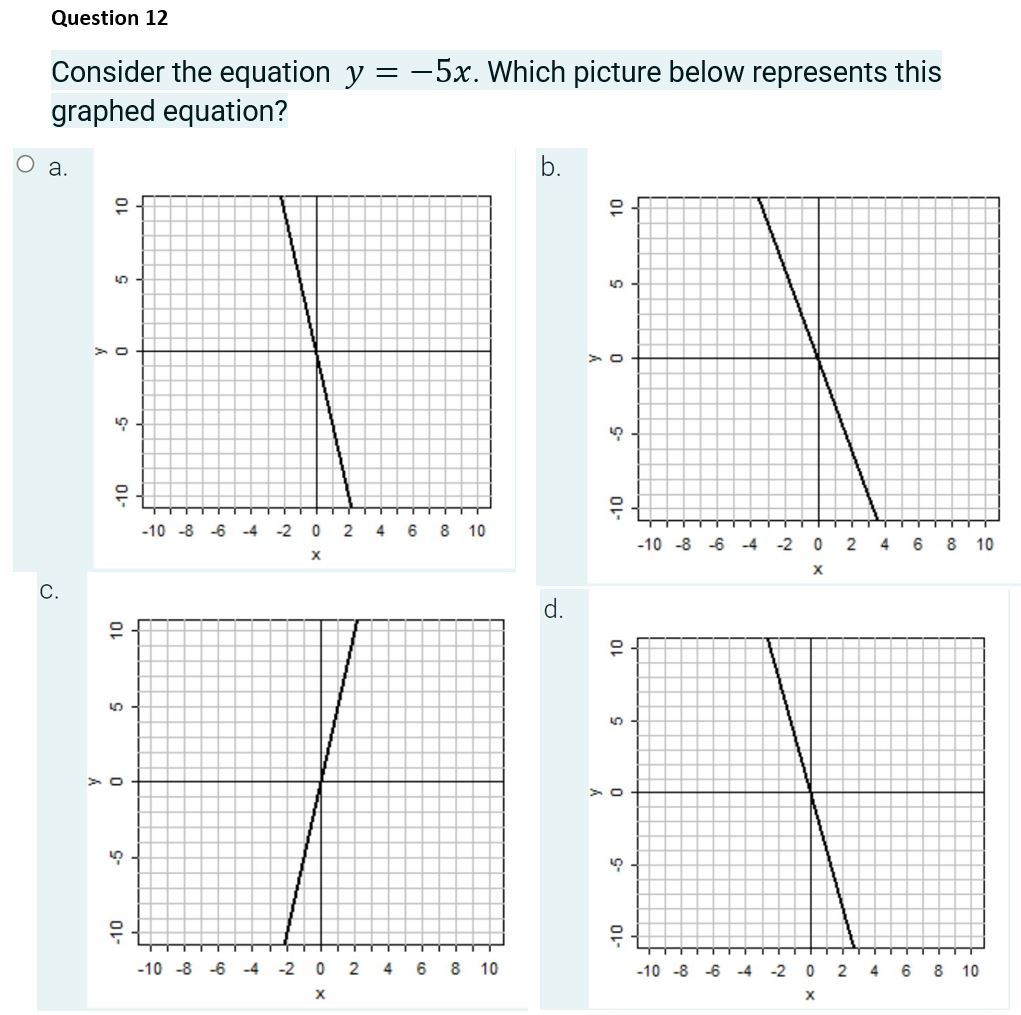
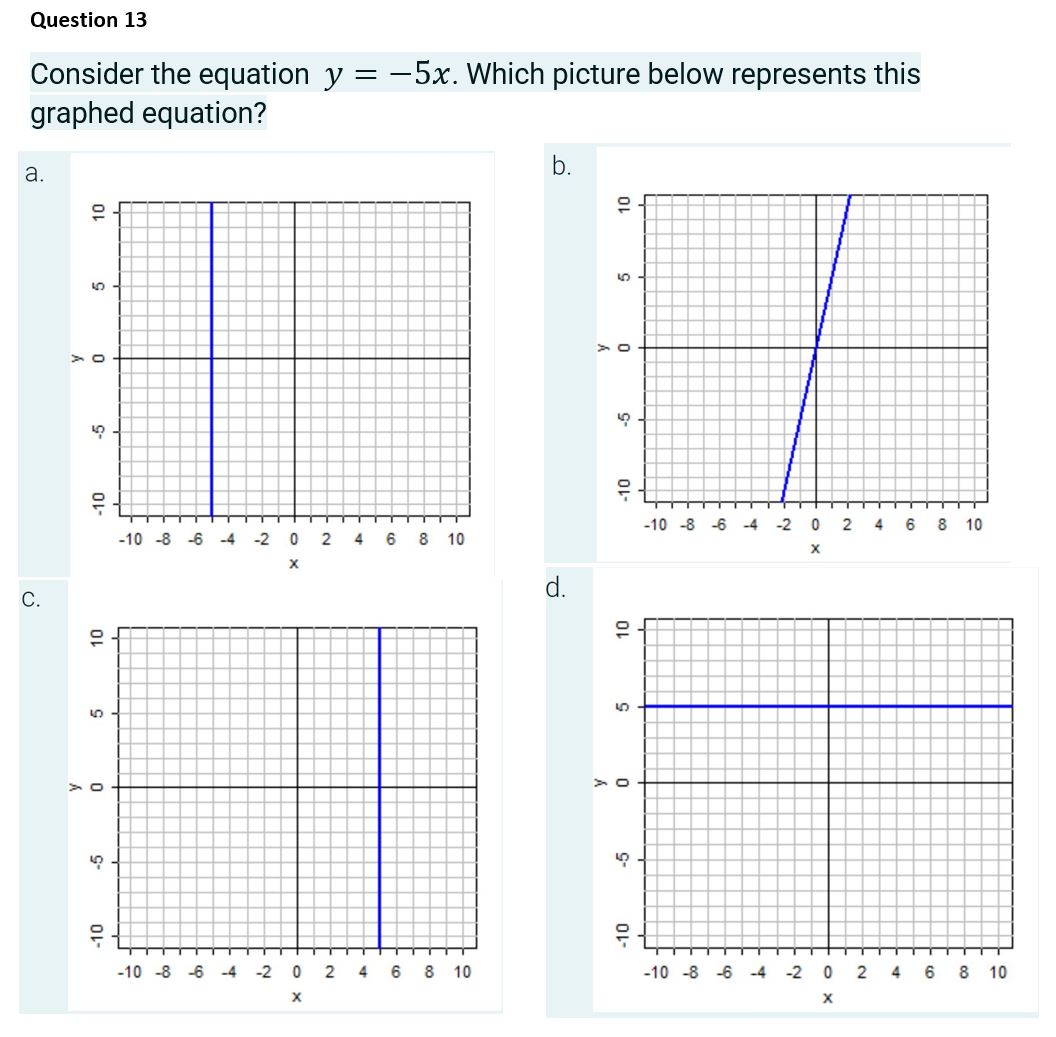
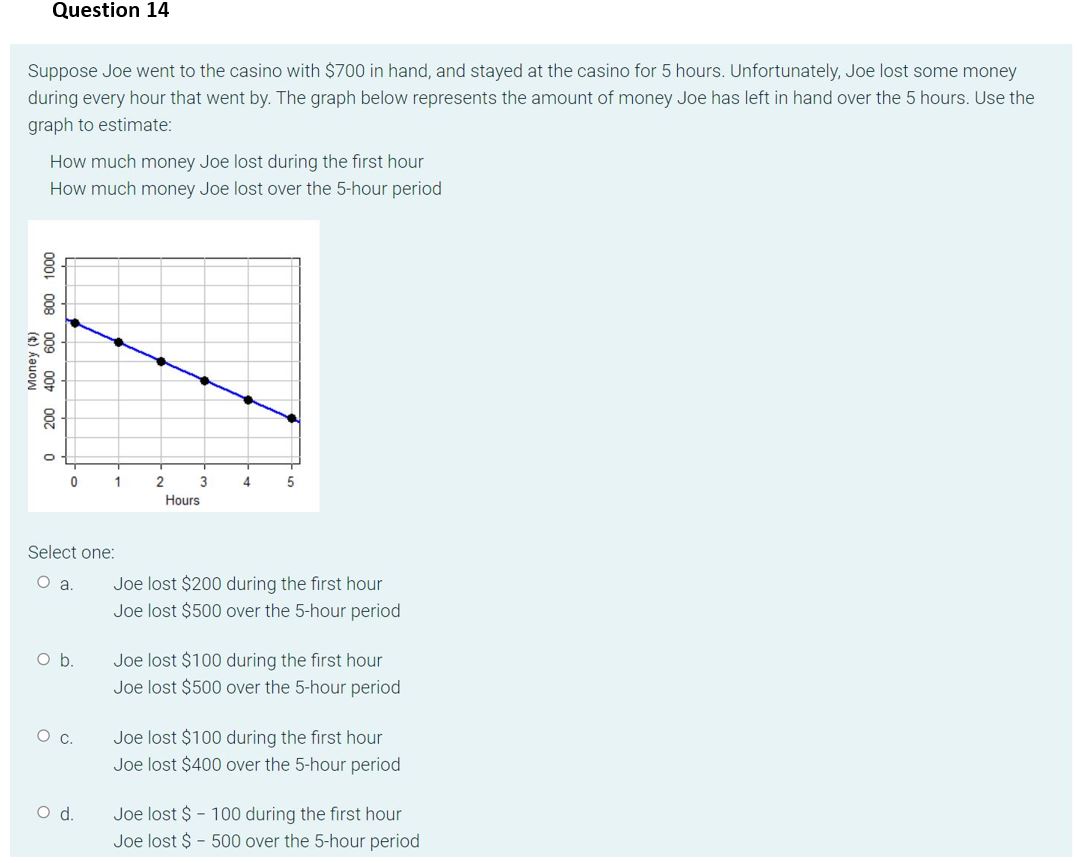
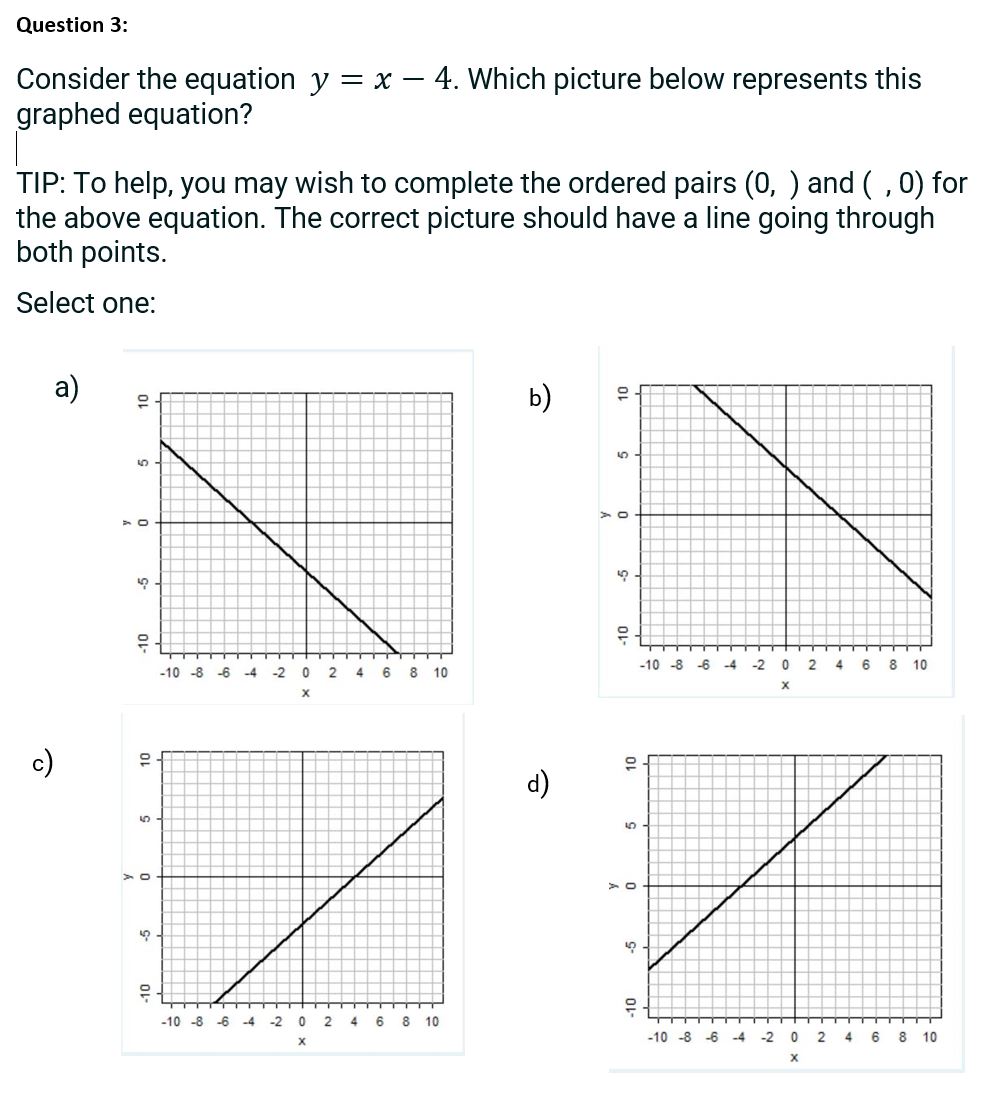
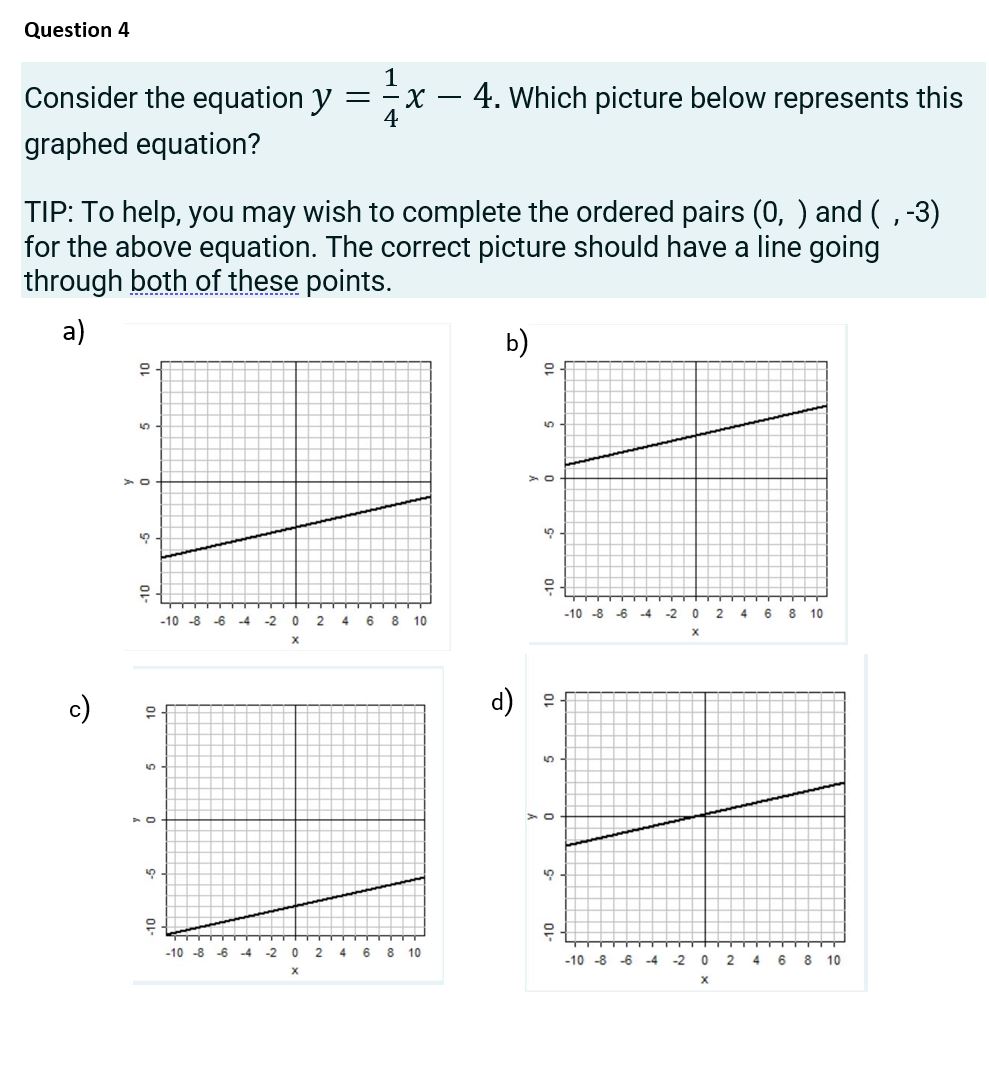
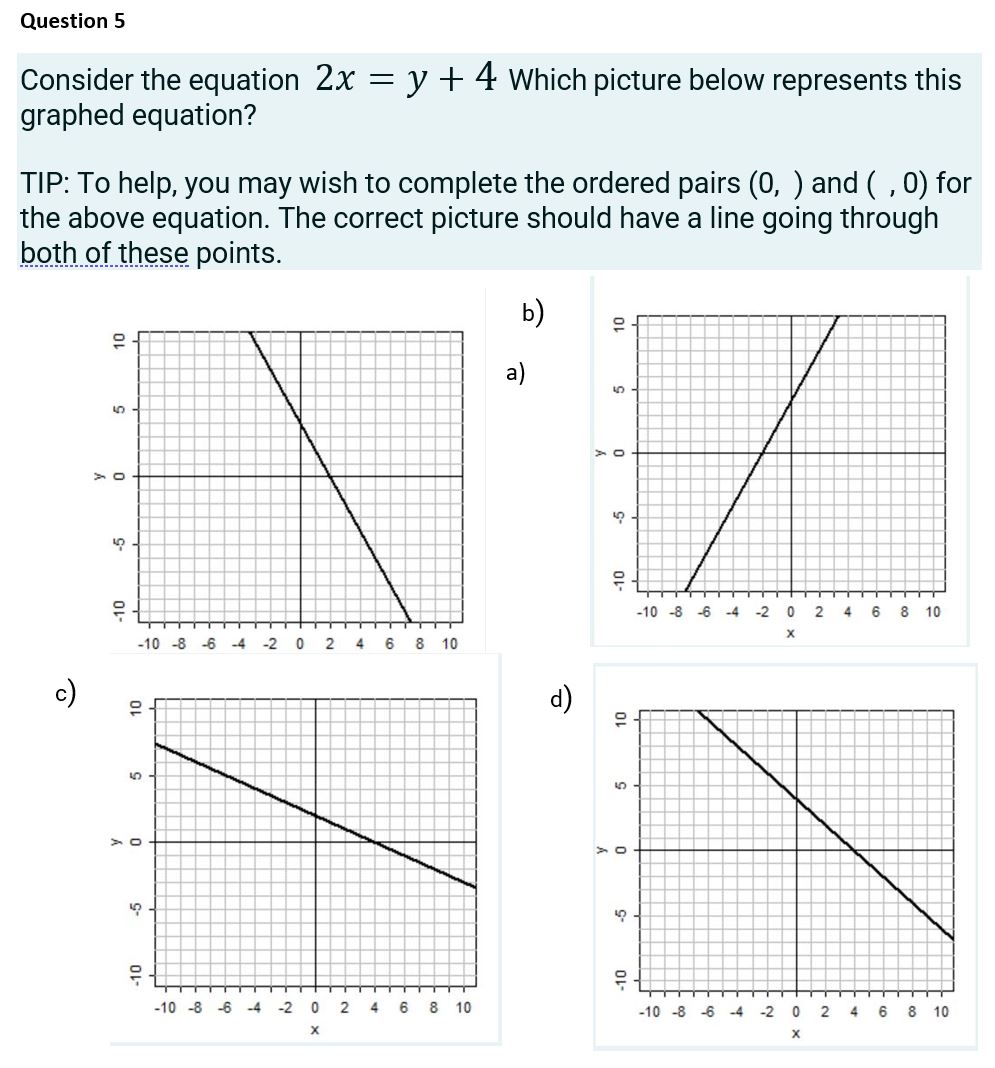
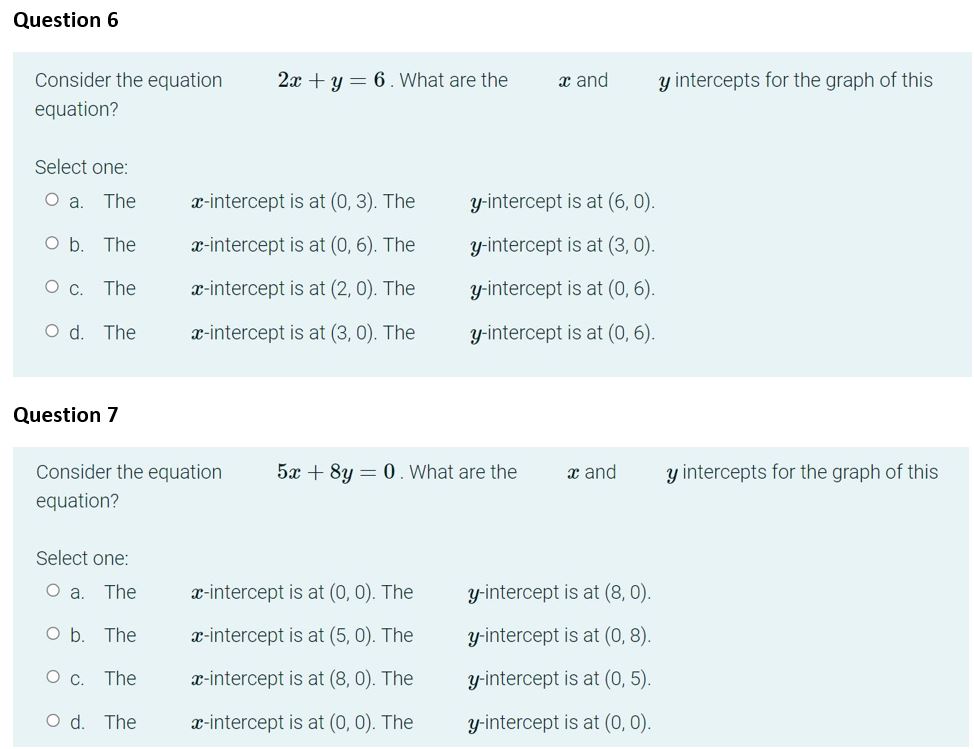
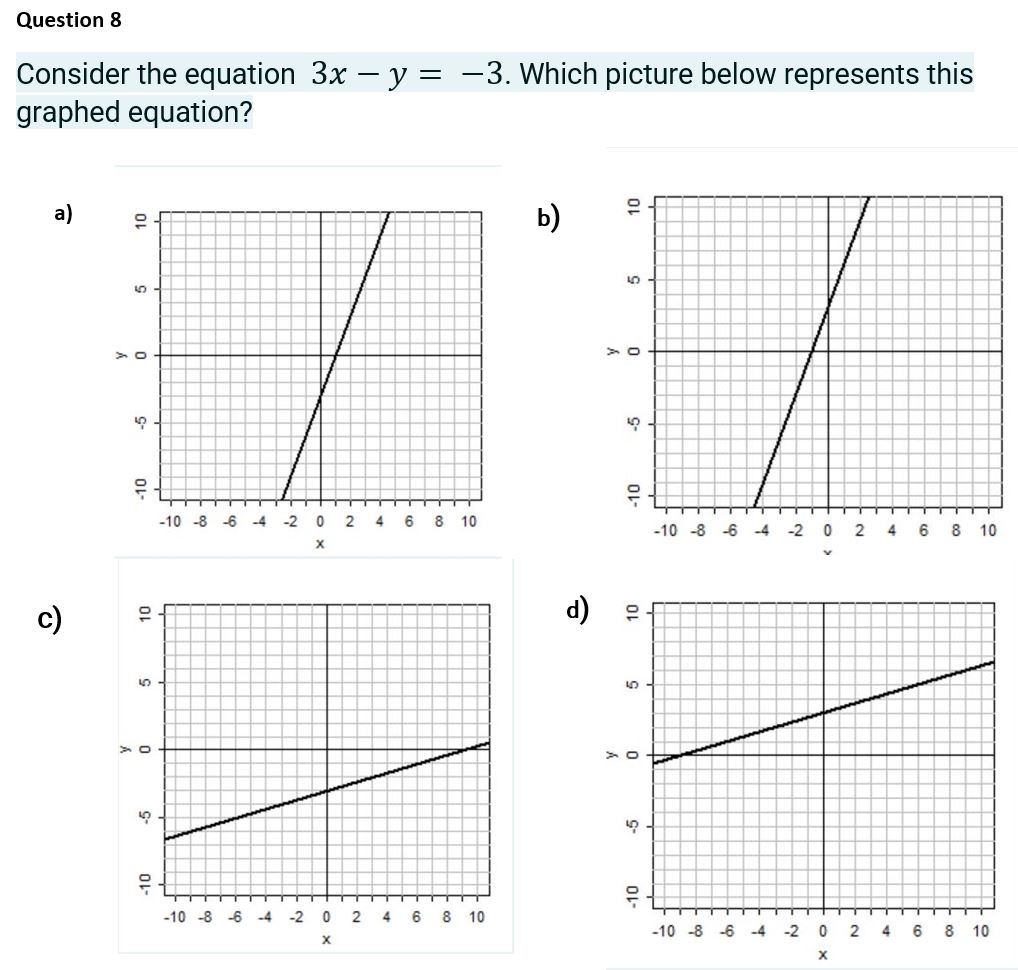
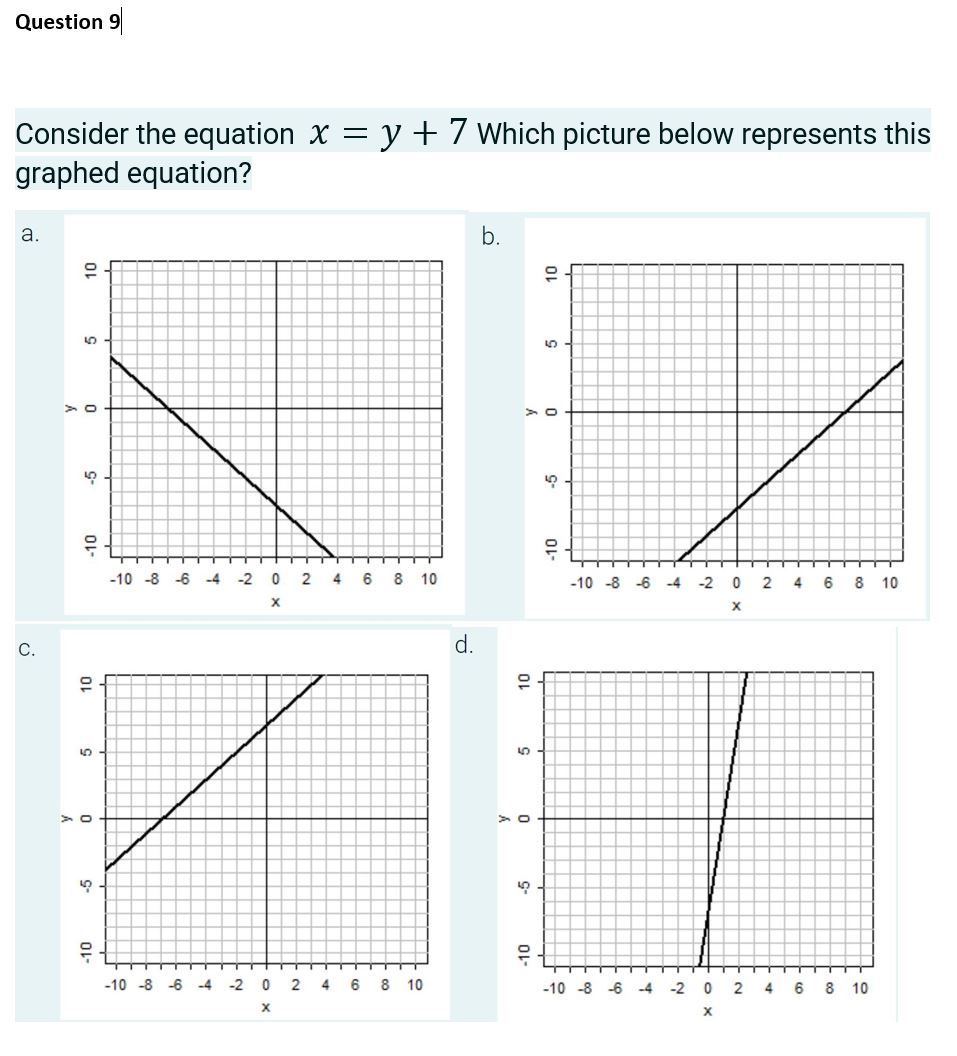
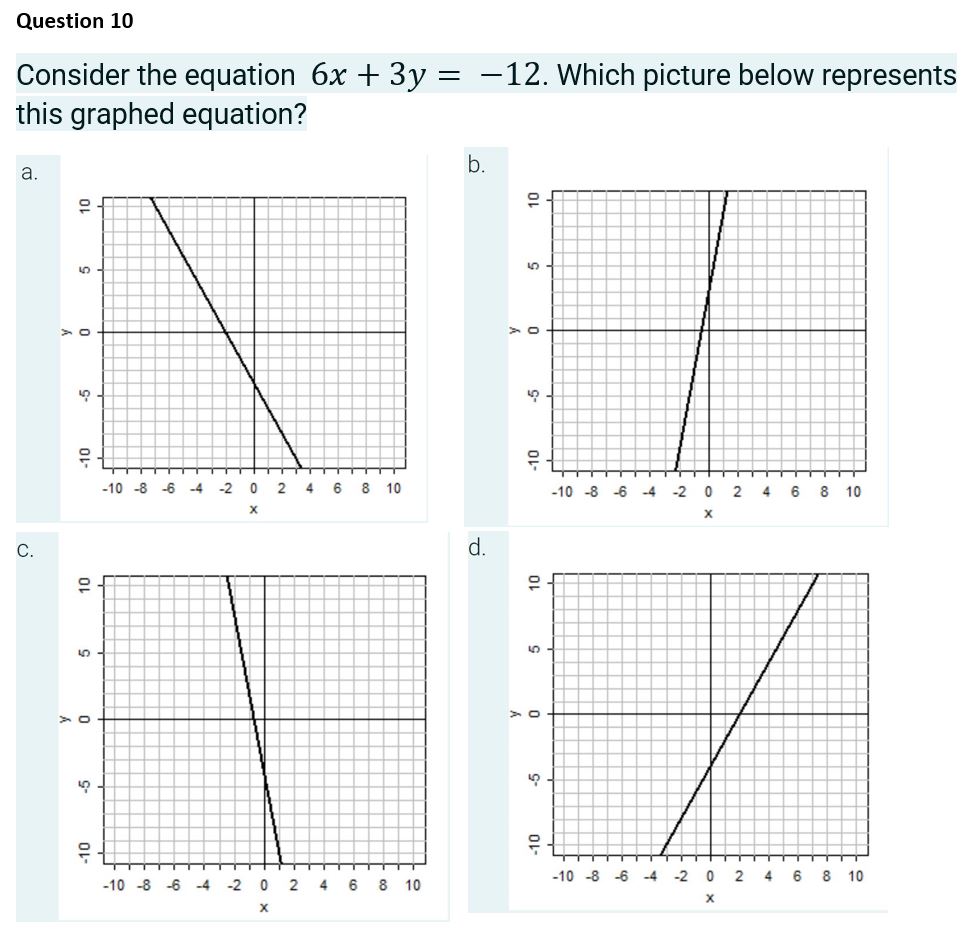
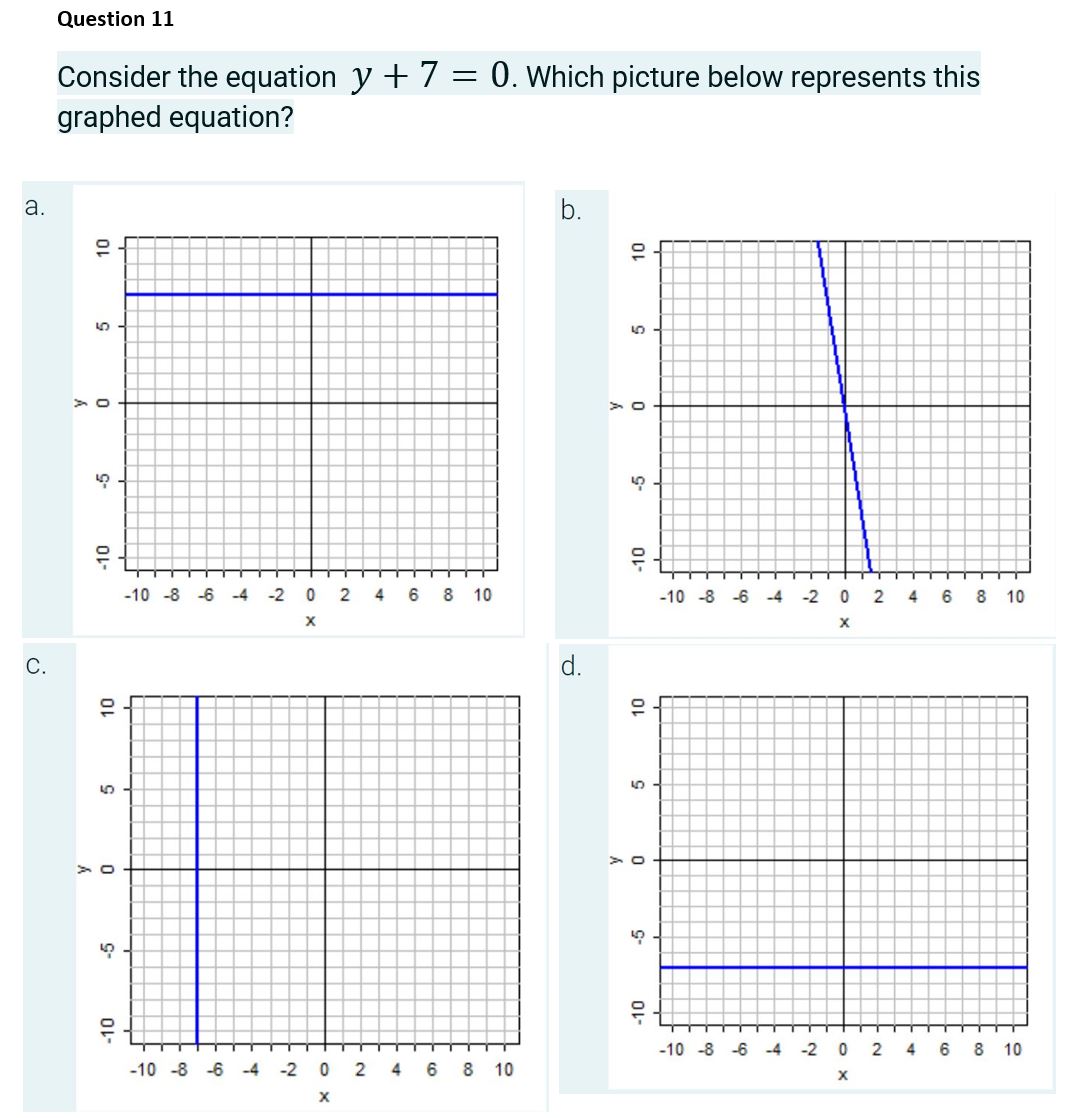
Question 1: Consider the point (-6, 0) in the rectangular co-ordinate system (Cartesian plane). Which picture below represents this point? Select one: 10 a) b) c) so to -10 -6 -3 0 3 6 9 10 6 -3 0 3 6 9 -10 6 -3 0 3 3 6 9 X d) 10 O 10 -10 -6 -3 0 3 6 9 Question 2: Complete the ordered pairs (0, ), ( , 0) and (2, ) using the equation y =-x +6: Select one: O a. (0, -6), (6, 0), (2, -4) O b. (0, 6), (6, 0), (2, 4) O c. (0, -6), (-6, 0), (2, -8) O d. (0, 6), (-6, 0), (2, 8)Question 12 Consider the equation y = -5x. Which picture below represents this graphed equation? O a. b. 2 2 -10 -8 6 -4 -2 0 2 4 6 8 10 X -10 -8 -6 -4 -2 0 2 4 6 8 C. d. -10 -8 -6 -4 -2 0 2 4 6 8 10 -10 -8 6 -4 -2 0 2 4 6 8 10 X XQuestion 13 Consider the equation y = 5x. Which picture below represents this graphed equation? _. *- - III\"!!- I]:' ++I ..I II. .I I -10-8-64-20246810 X Question 14 Suppose Joe went to the casino with $700 in hand, and stayed at the casino for 5 hours. Unfortunately, Joe lost some money during every hour that went by. The graph below represents the amount of money Joe has left in hand over the 5 hours. Use the graph to estimate: How much money Joe lost during the first hour How much money Joe lost over the 5-hour period 200 400 600 800 1000 Money (3) O 5 Hours Select one: O a. Joe lost $200 during the first hour Joe lost $500 over the 5-hour period O b. Joe lost $100 during the first hour Joe lost $500 over the 5-hour period O C. Joe lost $100 during the first hour Joe lost $400 over the 5-hour period O d. Joe lost $ - 100 during the first hour Joe lost $ - 500 over the 5-hour periodQuestion 3: Considerthe equation y = x 4. Which picture below represents this graphed equation? TIP: To help, you may wish to complete the ordered pairs (0, ) and ( , 0) for the above equation. The correct picture should have a line going through both points. Select one: a) ADJ-6440246310 X -10-8-8-4-2024B1 X Question 4 1 Consider the equation y = E x 4-. Which picture below represents this graphed equation? TIP: To help, you may wish to complete the ordered pairs (0, ) and ( ,-3) for the above equation. The correct picture should have a line going through .b.gt_h__9_t_ti1s Points 4036440245510 X 40364-202458"! X 4135444324133\": 40-8-6-4-20246810 x Question 5 Consider the equation 2x = y + 4- Which picture below represents this graphed equation? TIP: To help, you may wish to complete the ordered pairs (0, ) and ( , 0) for the above equation. The correct picture should have a line going through _l_3__qt_h__9_f__the PointS- -10-8-6-420246319 40.334402463111 x x Question 6 Consider the equation equation? Select one: 0 a. The 3- interoeptis at (O 3) The O p. The a: interceptis at (0 6) The O c. The 3- interceptis at (2 (.0) The 0 d. The a: intercept is at (3 0) The Question 7 Consider the equation equation? Select one: 0 a. The O b. The 0 c The 0 cl. The x- intercept Is at (0 0). The m-intercept is at(5 D). The z-intercept is at (8. 0.) The ( z-intercept is at 0, 0). The 2:: + y = 6 . What are the a: and yintercept is at (6, 0). yLintercept is at (3. 0). yintercept is at (O. 6). y-intercept is at (0. 6). 54: + 83; = 0 . What are the a: and yintercept Is at (B 0). yintercept is at(0 , 8) y intercept Is at (0 5) )- y intercept Is at (0 0 y intercepts for the graph of this 3,: intercapts for the graph of this Question 8 Consider the equation 3x -y = -3. Which picture below represents this graphed equation? a) b) -10 -8 5 -4 -2 0 2 4 6 8 10 -10 -8 -6 -4 -2 0 2 6 8 C) 2 d) 2 > O -10 -10 -8 6 -4 -2 0 2 4 6 8 -10 -8 -6 -4 - 0 2 4 6 8 10Question 9 Consider the equation x = y + 7 Which picture below represents this graphed equation? a. b. -10 -8 -6 -4 -2 0 2 4 6 8 -10 -8 6 -4 -2 0 2 6 8 10 X X C. d. 2 2 LO LO >0 -10 -8 -6 -2 4 6 8 10 -10 -8 -6 -2 0 2 6 8 10 X xQuestion 10 Consider the equation 6x + 3y = -12. Which picture below represents this graphed equation? b. a. LO -10 -10 -8 -6 -4 -2 0 2 4 6 8 10 -10 -8 -6 -4 -2 0 2 6 8 10 X C. O 2 LO -10 -10 -8 -6 6 -4 -2 0 2 6 8 10 -10 -8 -6 -2 0 2 4 6 8 10Question 11 Consider the equation y + 7 = 0. Which picture below represents this graphed equation? a b. 2 10 -10 -8 -6 -4 -2 0 2 4 6 8 10 -10 -8 6 -4 -2 0 2 4 6 8 x X C d. LD LD > O -10 -8 -6 -4 -2 0 2 6 8 10 -10 -8 -6 -4 -2 0 2 4 6 8 10 X X