

Question: Statistics and Probability questions,help find the correct answers . Question 11 Using your favorite statistics software package, you generate a scatter plot with a regression
Statistics and Probability questions,help find the correct answers
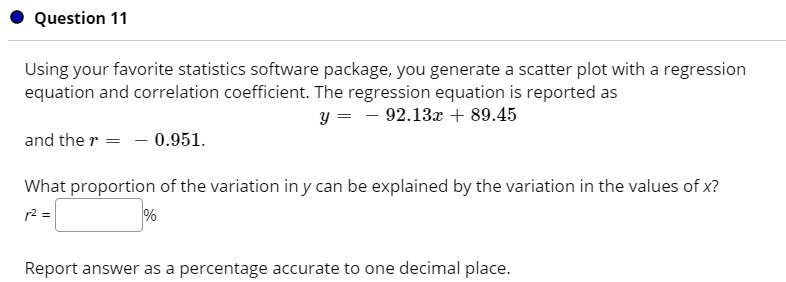
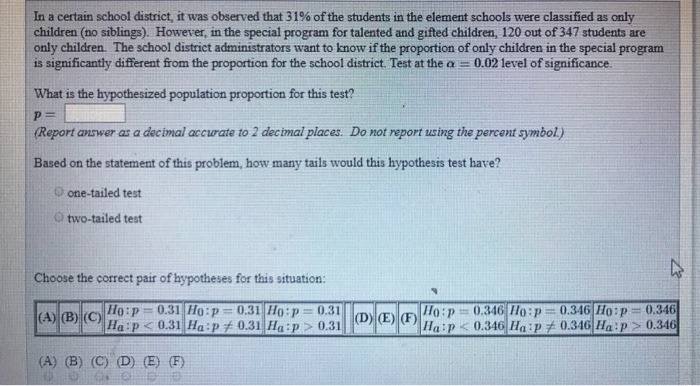
. Question 11 Using your favorite statistics software package, you generate a scatter plot with a regression equation and correlation coefficient. The regression equation is reported as y = - 92.13x + 89.45 and the r = - 0.951. What proportion of the variation in y can be explained by the variation in the values of x? 12 = % Report answer as a percentage accurate to one decimal place.In a certain school district, it was observed that 31% of the students in the element schools were classified as only children (no siblings). However, in the special program for talented and gifted children, 120 out of 347 students are only children. The school district administrators want to know if the proportion of only children in the special program is significantly different from the proportion for the school district. Test at the or = 0.02 level of significance. What is the hypothesized population proportion for this test? P = (Report answer as a decimal accurate to 2 decimal places. Do not report using the percent symbol.) Based on the statement of this problem, how many tails would this hypothesis test have? one-tailed test Q two-tailed test Choose the correct pair of hypotheses for this situation: (A) B) (C) Ho:p =0.31 Ho:p =0.31 Ho: p =0.31 Ho:p = 0.346 Ho : p= 0.346 Ho: p = 0.346 Ha :p 0.31 D E) (F) Ha:p 0.346 (A) (B) (C) (D) (E) (F)
Step by Step Solution
There are 3 Steps involved in it

Get step-by-step solutions from verified subject matter experts