

Question: Unit 3: Chapter 12.3 HW Progress s Score: 1/9 1/5 answered Question 2 Using your favorite statistics software package, you generate a scatter plot with

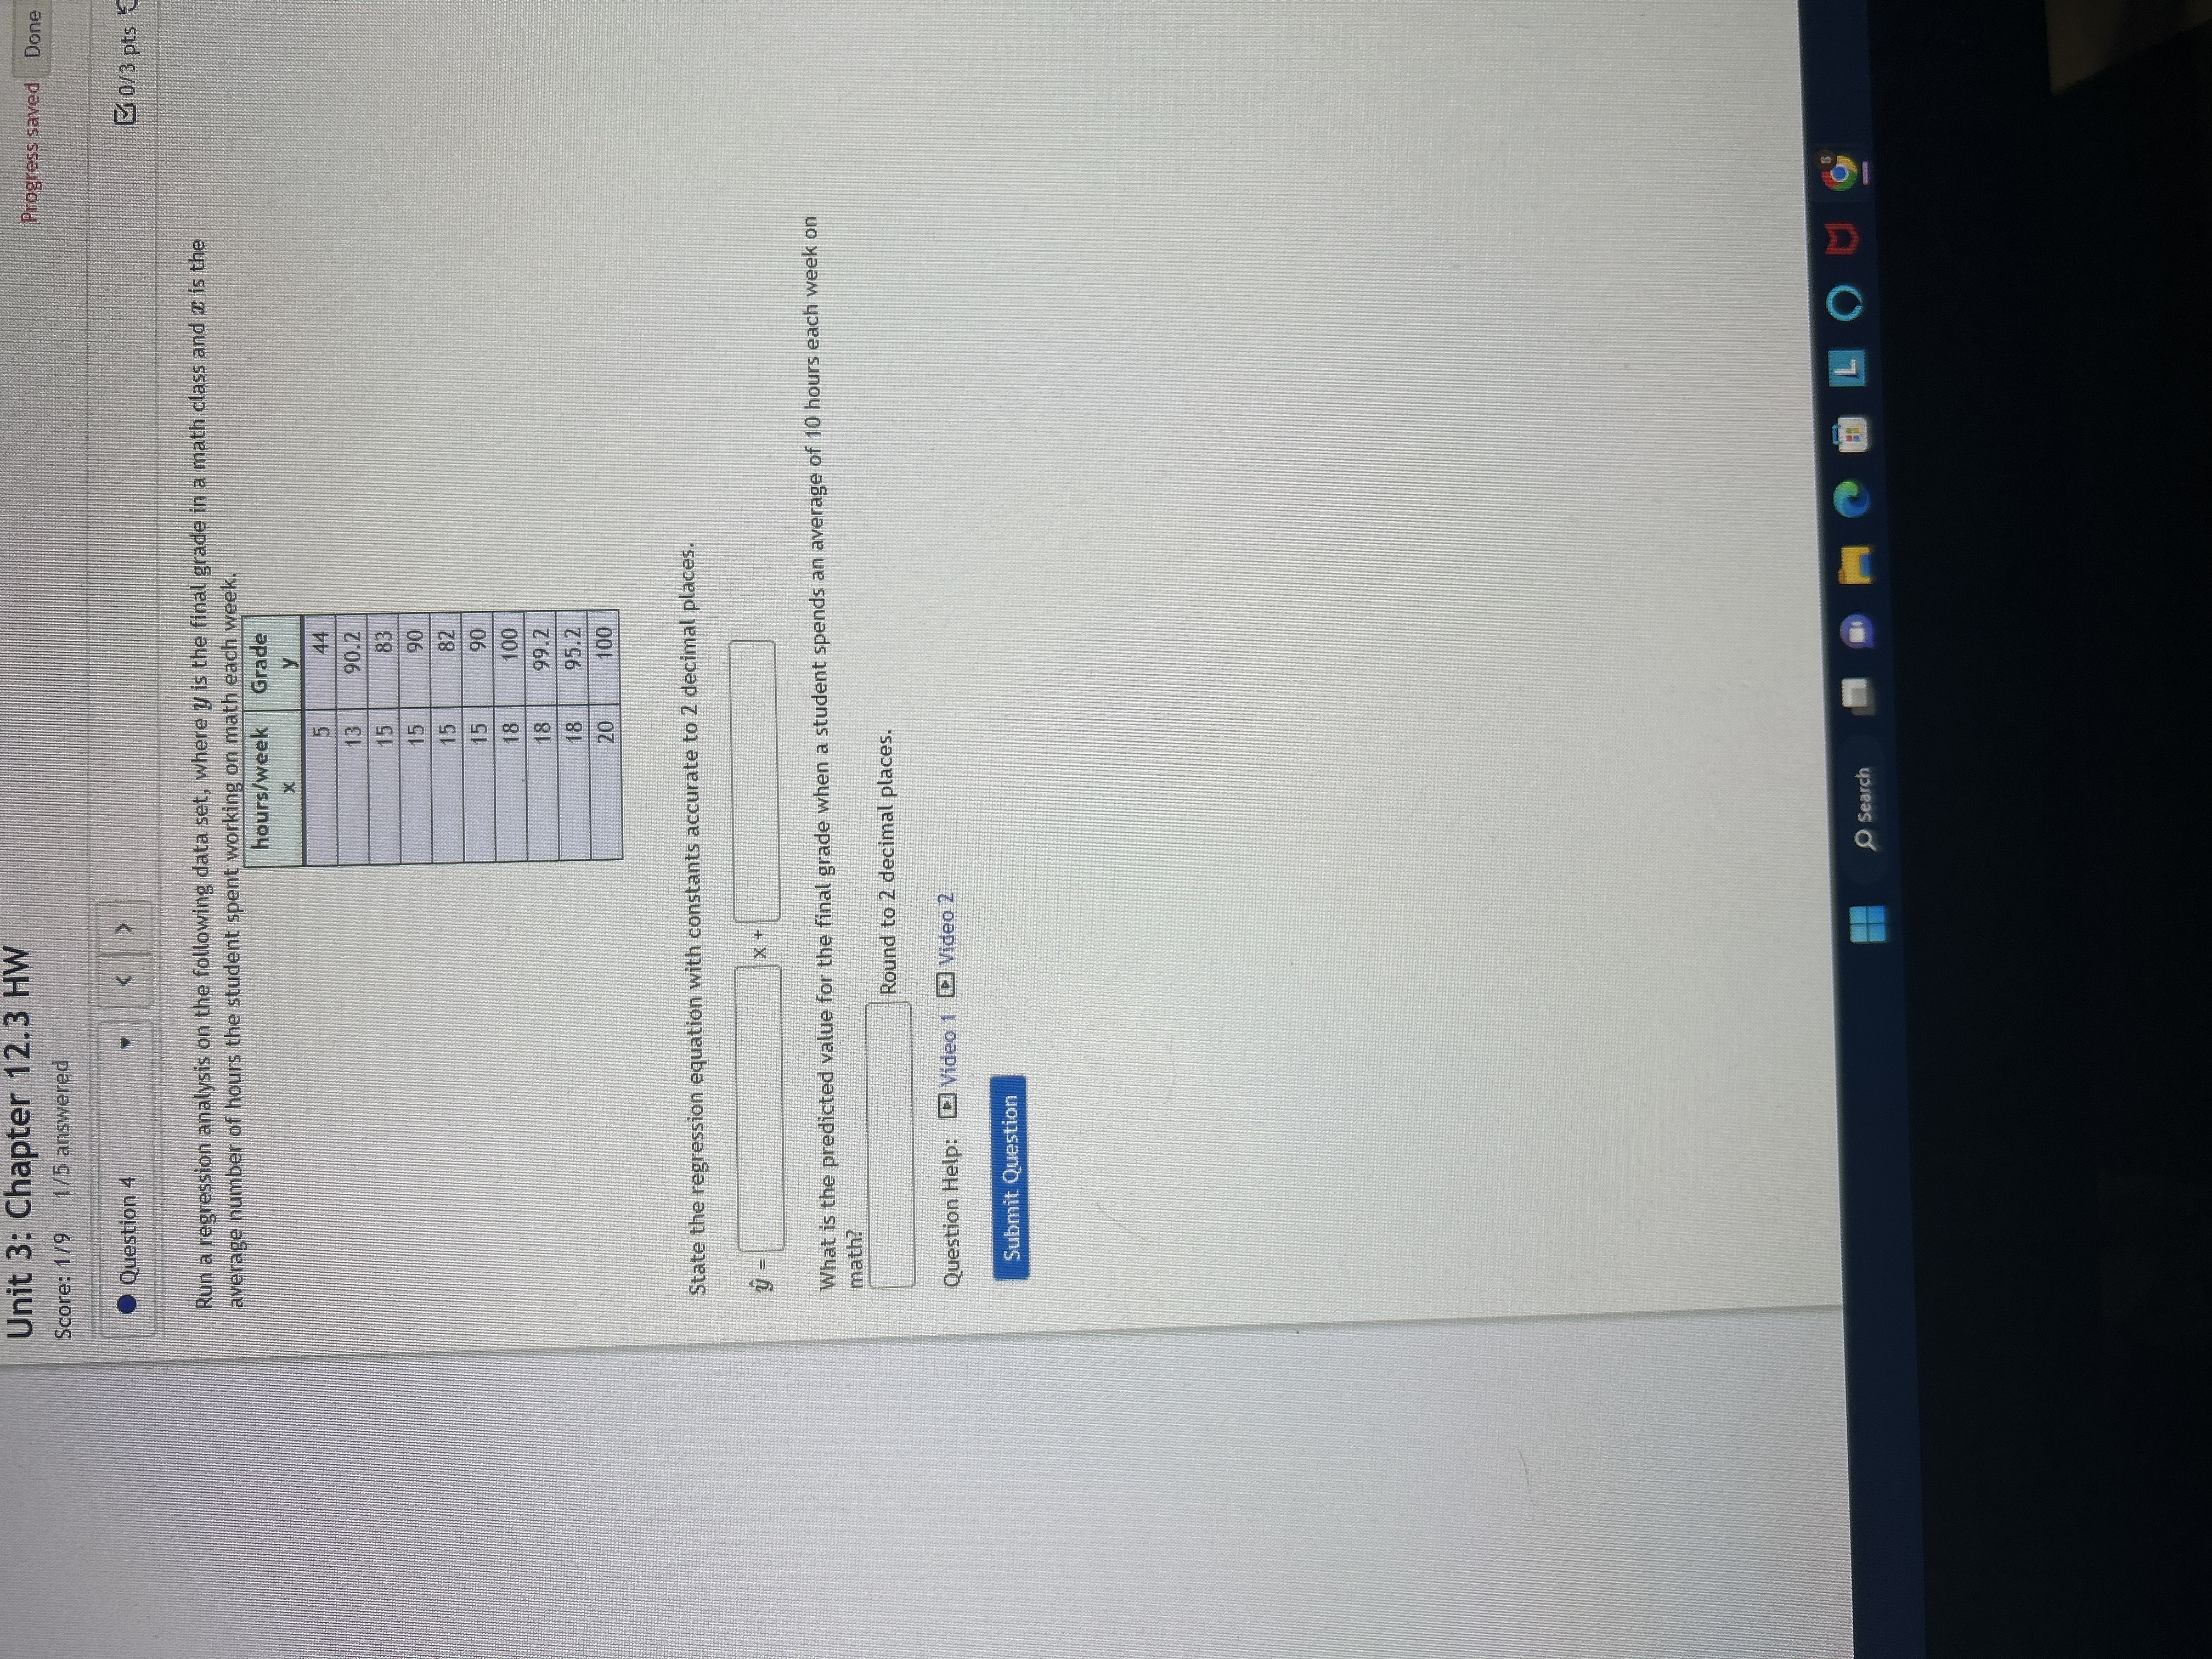
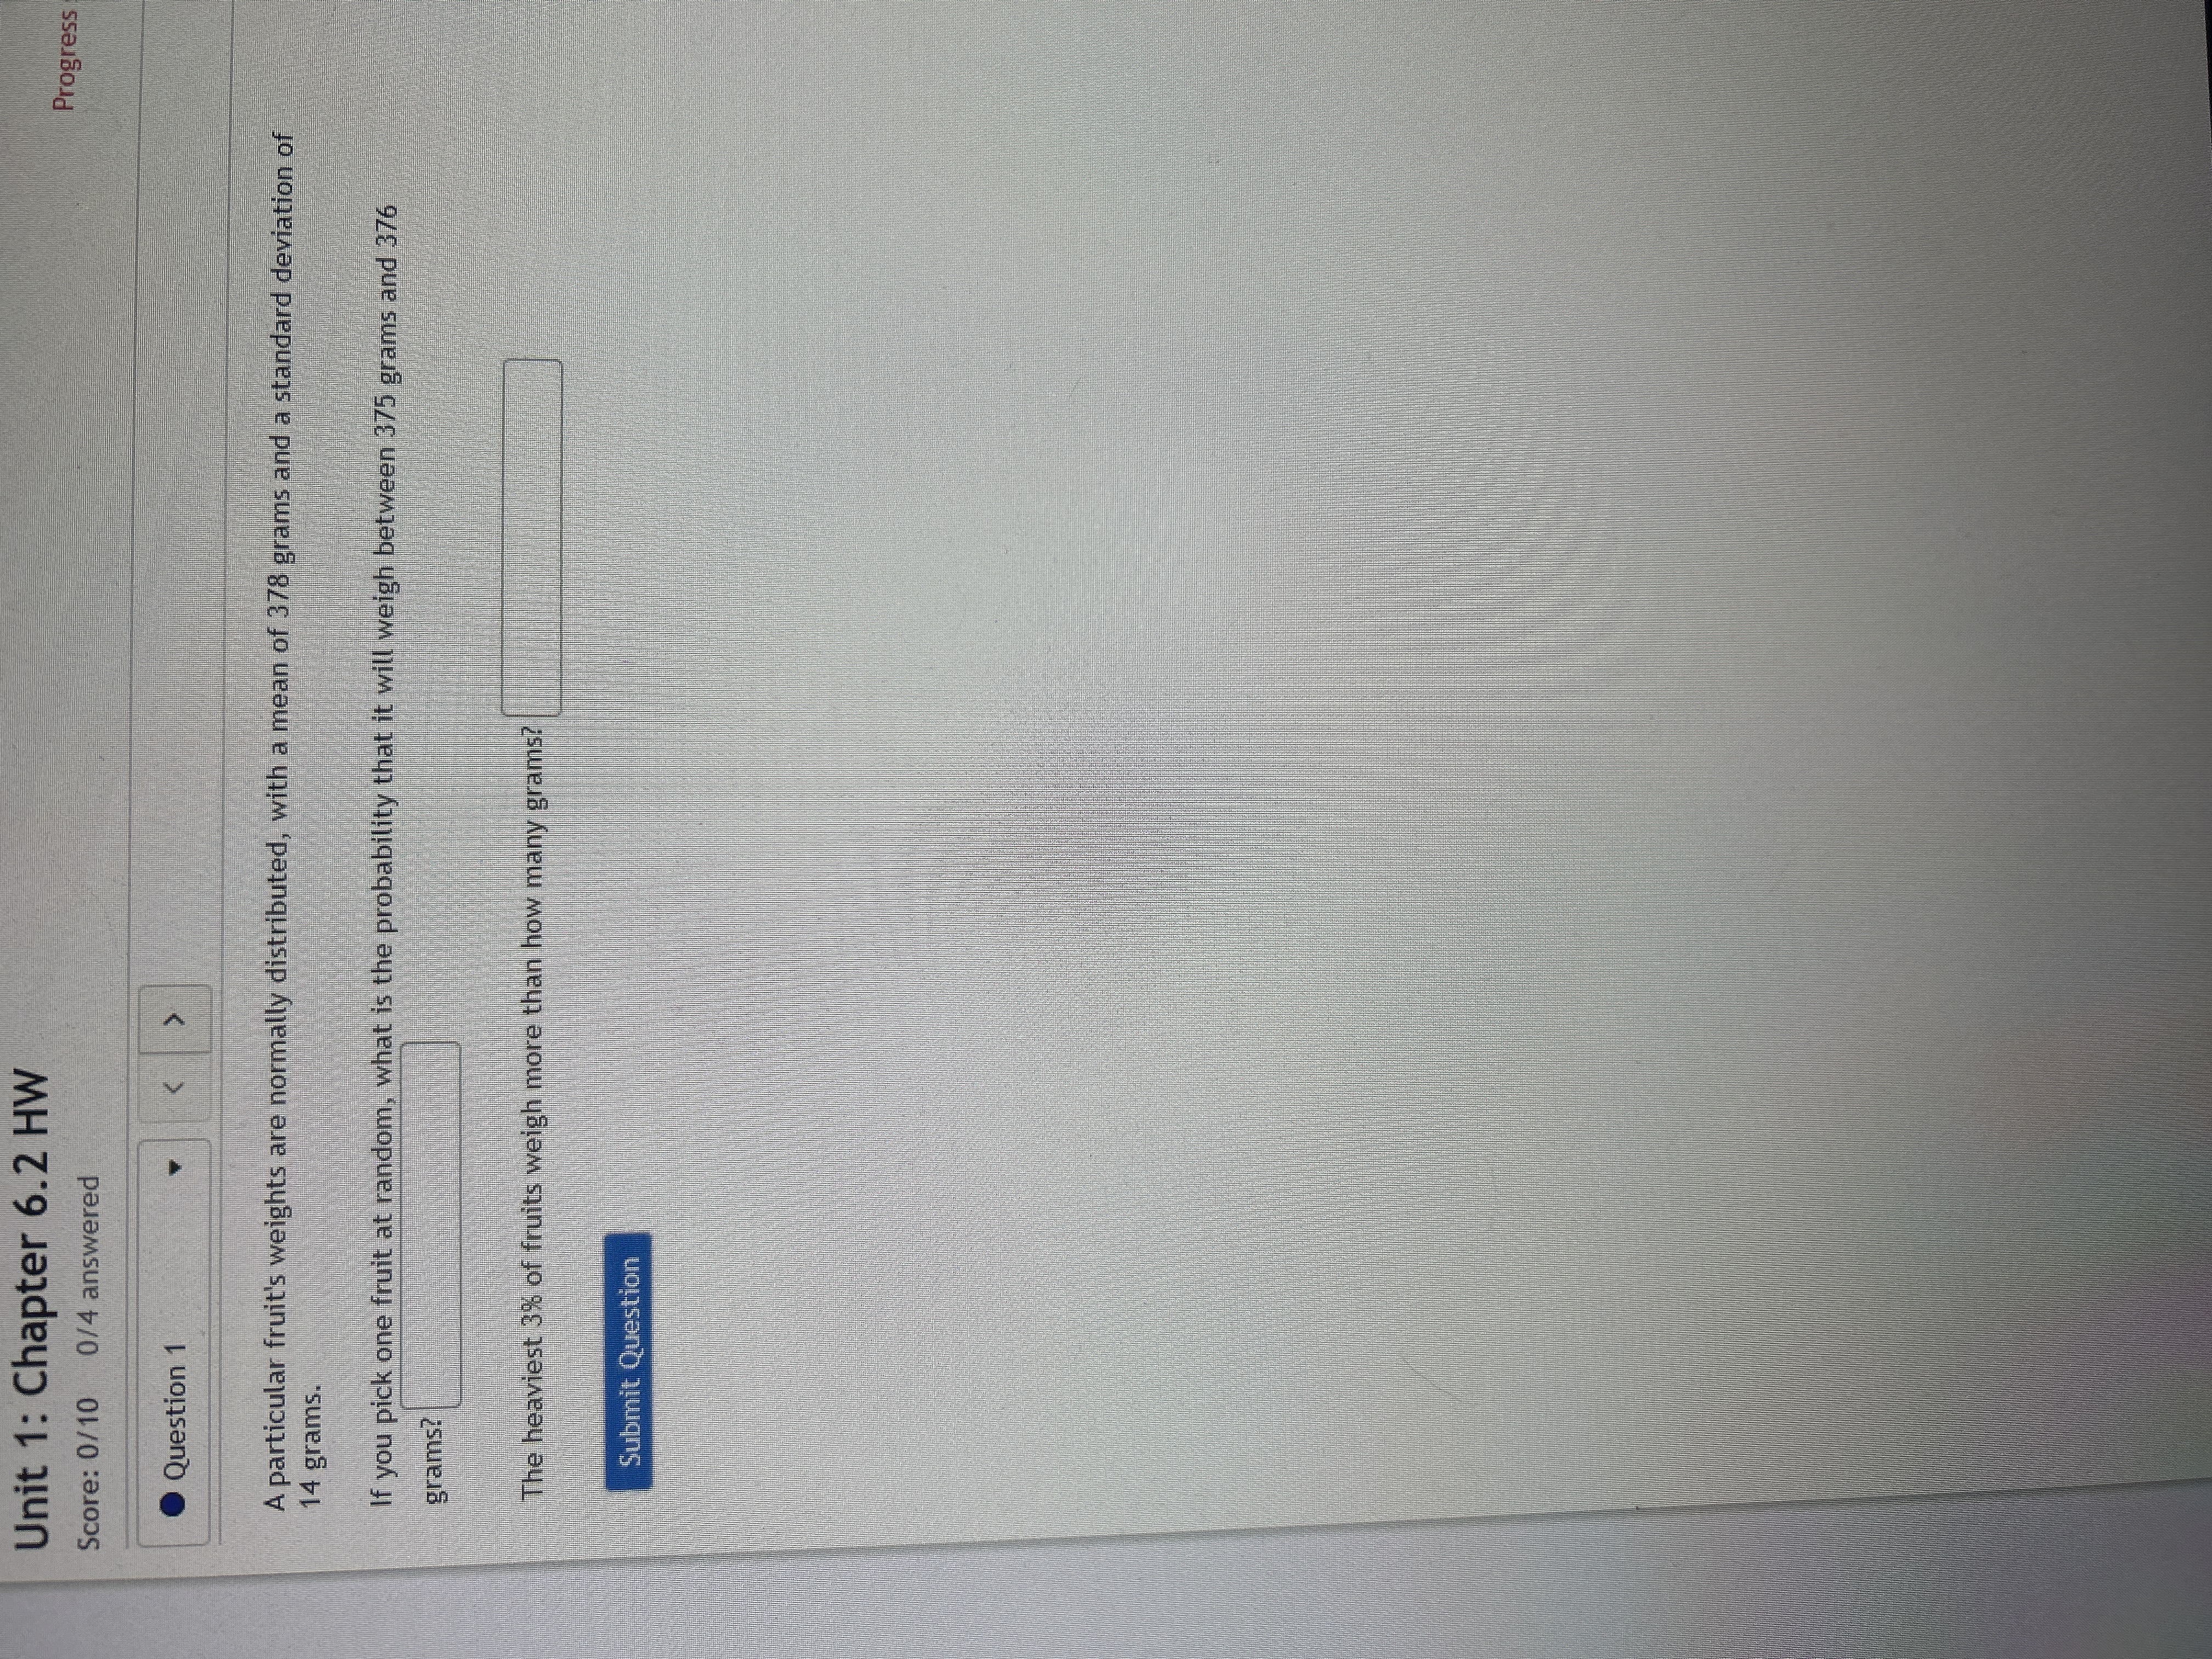

Unit 3: Chapter 12.3 HW Progress s Score: 1/9 1/5 answered Question 2 Using your favorite statistics software package, you generate a scatter plot with a regression equation and correlation coefficient. The regression equation is reported as y - 40.152 + 79.13 hat proportion of the variation in y can be explained by the linear regression equation found above? Report answer as a percentage accurate to one decimal place. Submit Question SearchUnit 3: Chapter 12.3 HW Score: 1/9 1/5 answered Progress saved Done Question 4 0/3 pts Run a regression analysis on the following data set, where y is the final grade in a math class and I is the average number of hours the student spent working on math each week. hours/week Grade y 5 44 13 90.2 15 83 15 90 15 82 15 90 18 100 18 99.2 18 95 .2 20 100 State the regression equation with constants accurate to 2 decimal places. y = What is the predicted value for the final grade when a student spends an average of 10 hours each week on math? Round to 2 decimal places. Question Help: Video 1 Video 2 Submit Question SearchUnit 1: Chapter 6.2 HW Progress Score: 0/10 0/4 answered Question 1 A particular fruit's weights are normally distributed, with a mean of 378 grams and a standard deviation of 14 grams. If you pick one fruit at random, what is the probability that it will weigh between 375 grams and 376 grams? The heaviest 3% of fruits weigh more than how many grams? Submit QuestionUnit 1: Chapter 6.2 HW Progress Score: 0/10 0/4 answered .Question 2 A manufacturer knows that their items have a normally distributed lifespan, with a mean of 4.9 years, and standard deviation of 1.2 years. The 4% of items with the shortest lifespan will last less than how many years? Give your answer to one decimal place. Submit
Step by Step Solution
There are 3 Steps involved in it

Get step-by-step solutions from verified subject matter experts