

Question: Statistics and Probability X 4 6 8 10 11 12 15 5 10 10 15 25 20 30 30 a) What is the equation for
Statistics and Probability
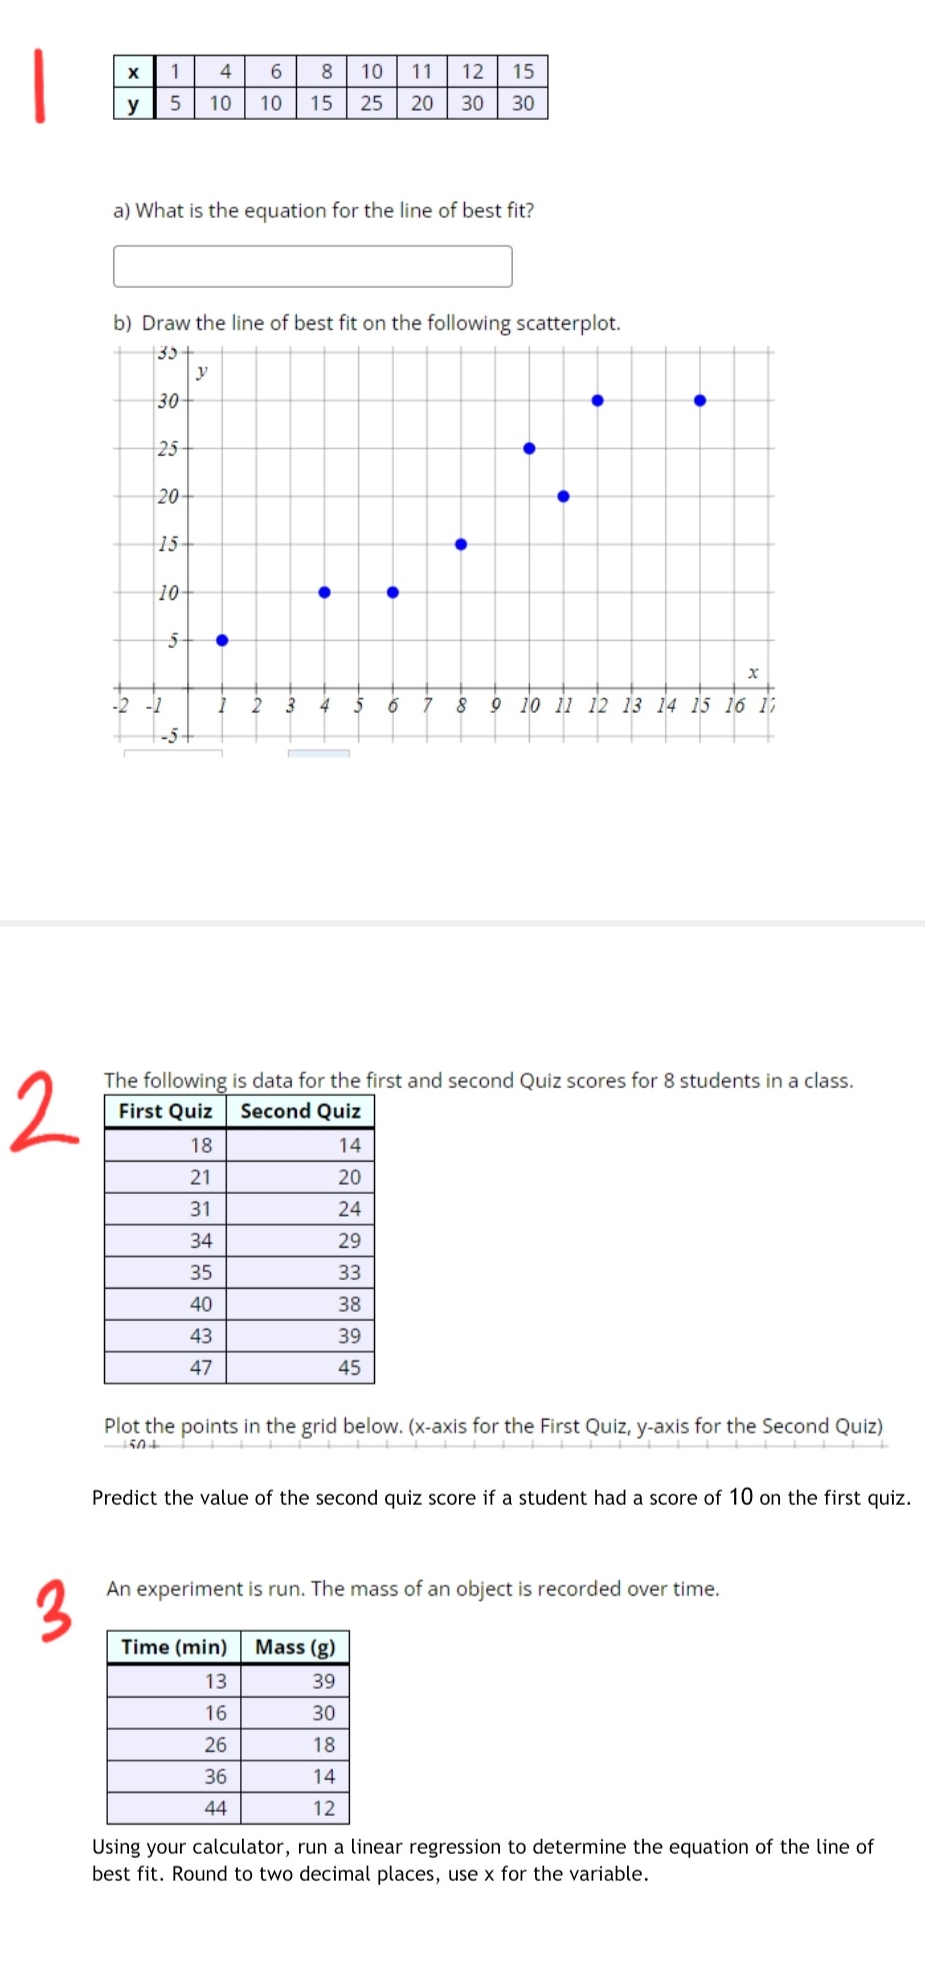
X 4 6 8 10 11 12 15 5 10 10 15 25 20 30 30 a) What is the equation for the line of best fit? b) Draw the line of best fit on the following scatterplot. 35 V 30 25 20 15 10 x 2 3 6 7 8 9 10 11 12 13 14 15 16 17 2 The following is data for the first and second Quiz scores for 8 students in a class. First Quiz Second Quiz 18 14 21 20 31 24 34 29 35 33 40 38 43 39 47 45 Plot the points in the grid below. (x-axis for the First Quiz, y-axis for the Second Quiz) 504 Predict the value of the second quiz score if a student had a score of 10 on the first quiz. An experiment is run. The mass of an object is recorded over time. W Time (min) Mass (g) 13 39 16 30 26 18 36 14 44 12 Using your calculator, run a linear regression to determine the equation of the line of best fit. Round to two decimal places, use x for the variable
Step by Step Solution
There are 3 Steps involved in it

Get step-by-step solutions from verified subject matter experts