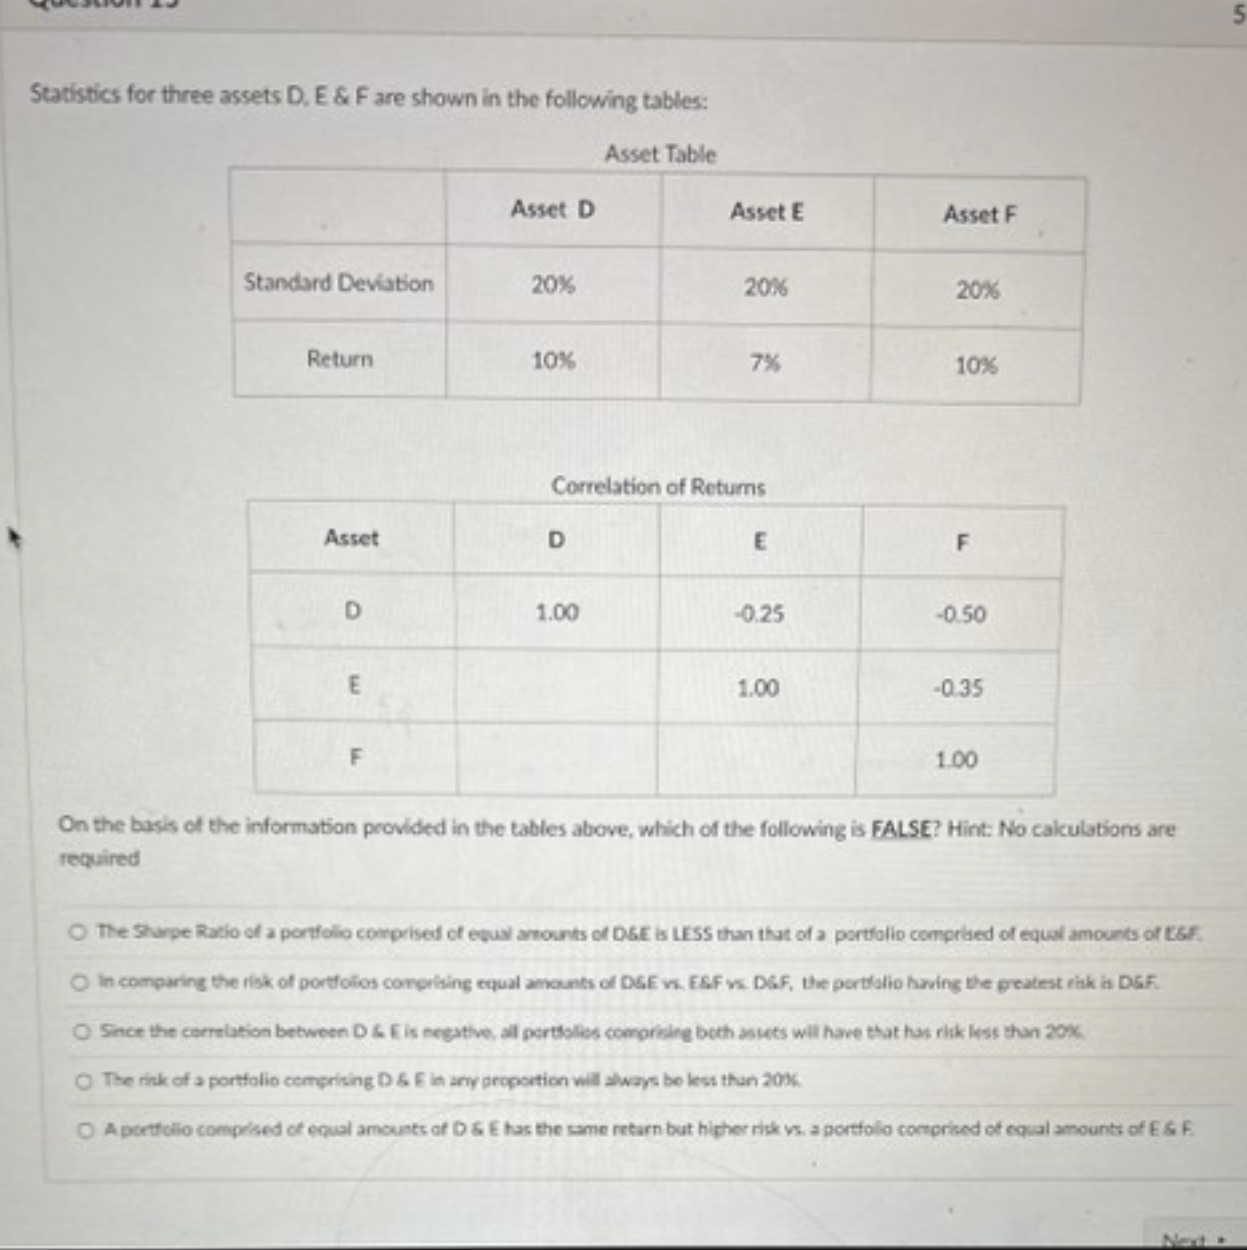
Question: Statistics for three assets D. E & F are shown in the following tables: Asset Table Asset D Asset E Asset F Standard Deviation 20%

Statistics for three assets D. E & F are shown in
Statistics for three assets D. E & F are shown in the following tables: Asset Table Asset D Asset E Asset F Standard Deviation 20% 20% 20% Return 10% 7% 10% Correlation of Returns Asset D E D 1.00 -0.25 -0.50 E 1.00 -0.35 1.00 On the basis of the information provided in the tables above, which of the following is FALSE? Hint: No calculations are required The Sharpe Ratio of a portfolio comprised of equal amounts of DGE is LESS than that of a portfolio comprised of equal amounts of (SF. In comparing the risk of portfolios comprising equal amounts of DGE vi. ESF vs. D&.F, the portfolio having the greatest risk is D&F. Since the correlation between D & E is negative, all portfolios comprising both assets will have that has rick less than 20% The rink of a portfolio comprising D & E in any proportion will always be less than 20%. O A portfolio comprised of equal amounts of D & E has the same return but higher risk vs. a portfolio comprised of equal amounts of E & F

Step by Step Solution

There are 3 Steps involved in it

1 Expert Approved Answer
Step: 1 Unlock blur-text-image
Question Has Been Solved by an Expert!

Get step-by-step solutions from verified subject matter experts

Step: 2 Unlock
Step: 3 Unlock

Students Have Also Explored These Related Finance Questions!