

Question: Statistics for three assets A, B & C are shown in the following tables: Asset Table Asset Table Asset A Asset B Asset C Standard
Statistics for three assets A, B & C are shown in the following tables:
Asset Table
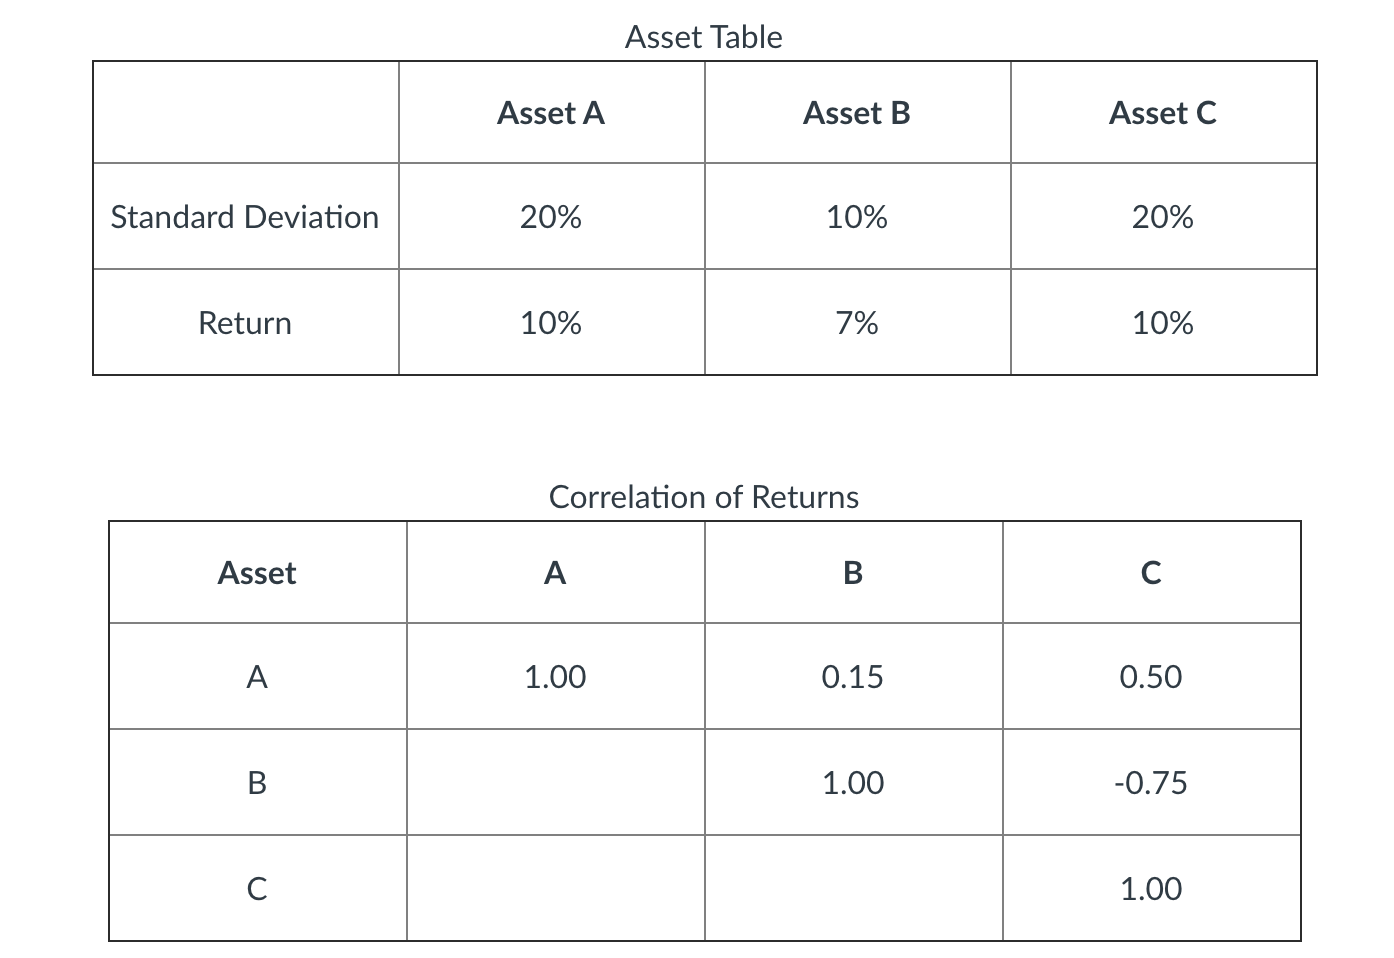
Asset Table Asset A Asset B Asset C Standard Deviation 20% 10% 20% Return 10% 7% 10% Correlation of Returns Asset A B C A 1.00 0.15 0.50 B 1.00 -0.75 C 1.00
Step by Step Solution
There are 3 Steps involved in it
1 Expert Approved Answer
Step: 1 Unlock

Question Has Been Solved by an Expert!
Get step-by-step solutions from verified subject matter experts
Step: 2 Unlock
Step: 3 Unlock