

Question: Statistics Help A machine is used to fill cans with motor oil additive. A single sample can is selected every hour and the weight of
Statistics Help
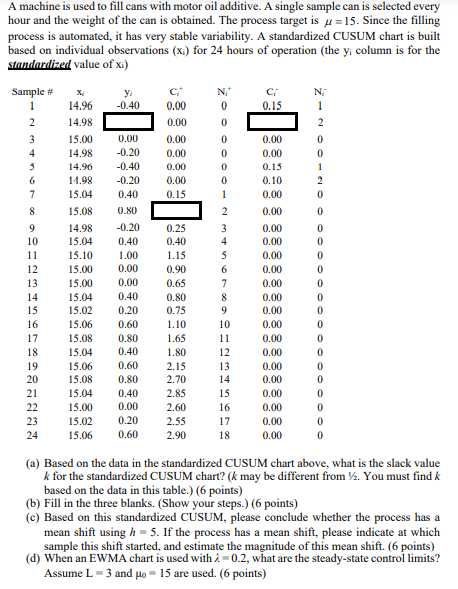
A machine is used to fill cans with motor oil additive. A single sample can is selected every hour and the weight of the can is obtained. The process target is a = 15. Since the filling process is automated, it has very stable variability. A standardized CUSUM chart is built based on individual observations (x ) for 24 hours of operation (the y; column is for the standardized value of xi) Sample # 14.96 -0.40 0.00 0 0.15 14.98 0.00 0 15.00 0.00 0.00 0.00 14.98 -0.20 0.00 0.00 14.96 -0.40 0.00 -9090 0.15 14.98 -0.20 0.00 0.10 15.04 0.40 0.15 0.00 8 15.08 0.80 0.00 9 14.98 -0.20 0.25 3 0.00 10 15.04 0.40 0.40 0.00 11 15.10 1.00 1.15 0.00 12 15.00 0.00 0.90 0.00 13 15.00 0.00 0.65 7 0.00 0606080808080600 0 0-30 14 15.04 0.40 0.80 8 0.00 15 15.02 0.20 0.75 g 0.00 16 15.06 0.60 1.10 10 0.00 17 15.08 0.80 1.65 11 0.00 18 15.04 0.40 1.80 12 0.00 19 15.06 0.60 2.15 13 0.00 20 15.08 0.80 2.70 14 0.00 21 15.04 0.40 2.85 15 0.00 15.00 0.00 2.60 16 0.00 15.02 0.20 2.55 17 0.00 24 15.06 0.60 2.90 18 0.00 (a) Based on the data in the standardized CUSUM chart above, what is the slack value & for the standardized CUSUM chart? (k may be different from V. You must find & based on the data in this table.) (6 points) (b) Fill in the three blanks. (Show your steps.) (6 points) (c) Based on this standardized CUSUM, please conclude whether the process has a mean shift using h - 5. If the process has a mean shift, please indicate at which sample this shift started, and estimate the magnitude of this mean shift. (6 points) (d) When an EWMA chart is used with / = 0.2, what are the steady-state control limits? Assume L = 3 and po = 15 are used. (6 points)
Step by Step Solution
There are 3 Steps involved in it

Get step-by-step solutions from verified subject matter experts