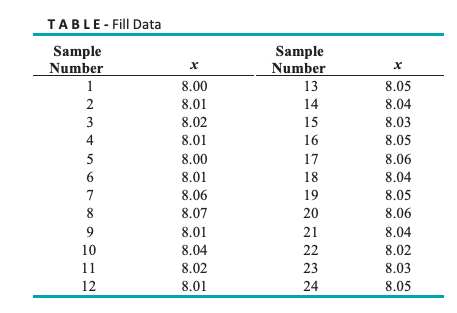
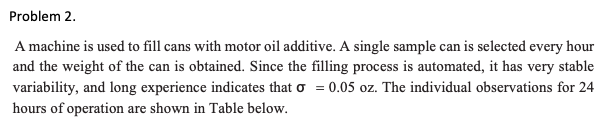
Question: TABLE - Fill Data Sample Number Sample Number 8.00 8.05 8.04 8.01 8.02 8.03 8.01 8.00 8.06 8.05 8.06 8.04 8.05 8.06 8.04 8.02 8.03

TABLE - Fill Data Sample Number Sample NumberTABLE - Fill Data Sample Number Sample NumberTABLE - Fill Data Sample Number Sample Number

TABLE - Fill Data Sample Number Sample Number 8.00 8.05 8.04 8.01 8.02 8.03 8.01 8.00 8.06 8.05 8.06 8.04 8.05 8.06 8.04 8.02 8.03 8.05 8.02 8.01 Reconsider the data in Problem 2. Set up an EWMA control chart with 1 = 0.2 and L = 3 for this process. Interpret the results. Problem 2. A machine is used to fill cans with motor oil additive. A single sample can is selected every hour and the weight of the can is obtained. Since the filling process is automated, it has very stable variability, and long experience indicates that o = 0.05 oz. The individual observations for 24 hours of operation are shown in Table below

Step by Step Solution

There are 3 Steps involved in it

1 Expert Approved Answer
Step: 1 Unlock blur-text-image
Question Has Been Solved by an Expert!

Get step-by-step solutions from verified subject matter experts

Step: 2 Unlock
Step: 3 Unlock

Students Have Also Explored These Related General Management Questions!