

Question: Statistics Please answer the question 1 and 3 below the attachment please show your work Question 3 (3 points) 1. Sketch a normal distribution graph
Statistics
Please answer the question 1 and 3 below the attachment please show your work
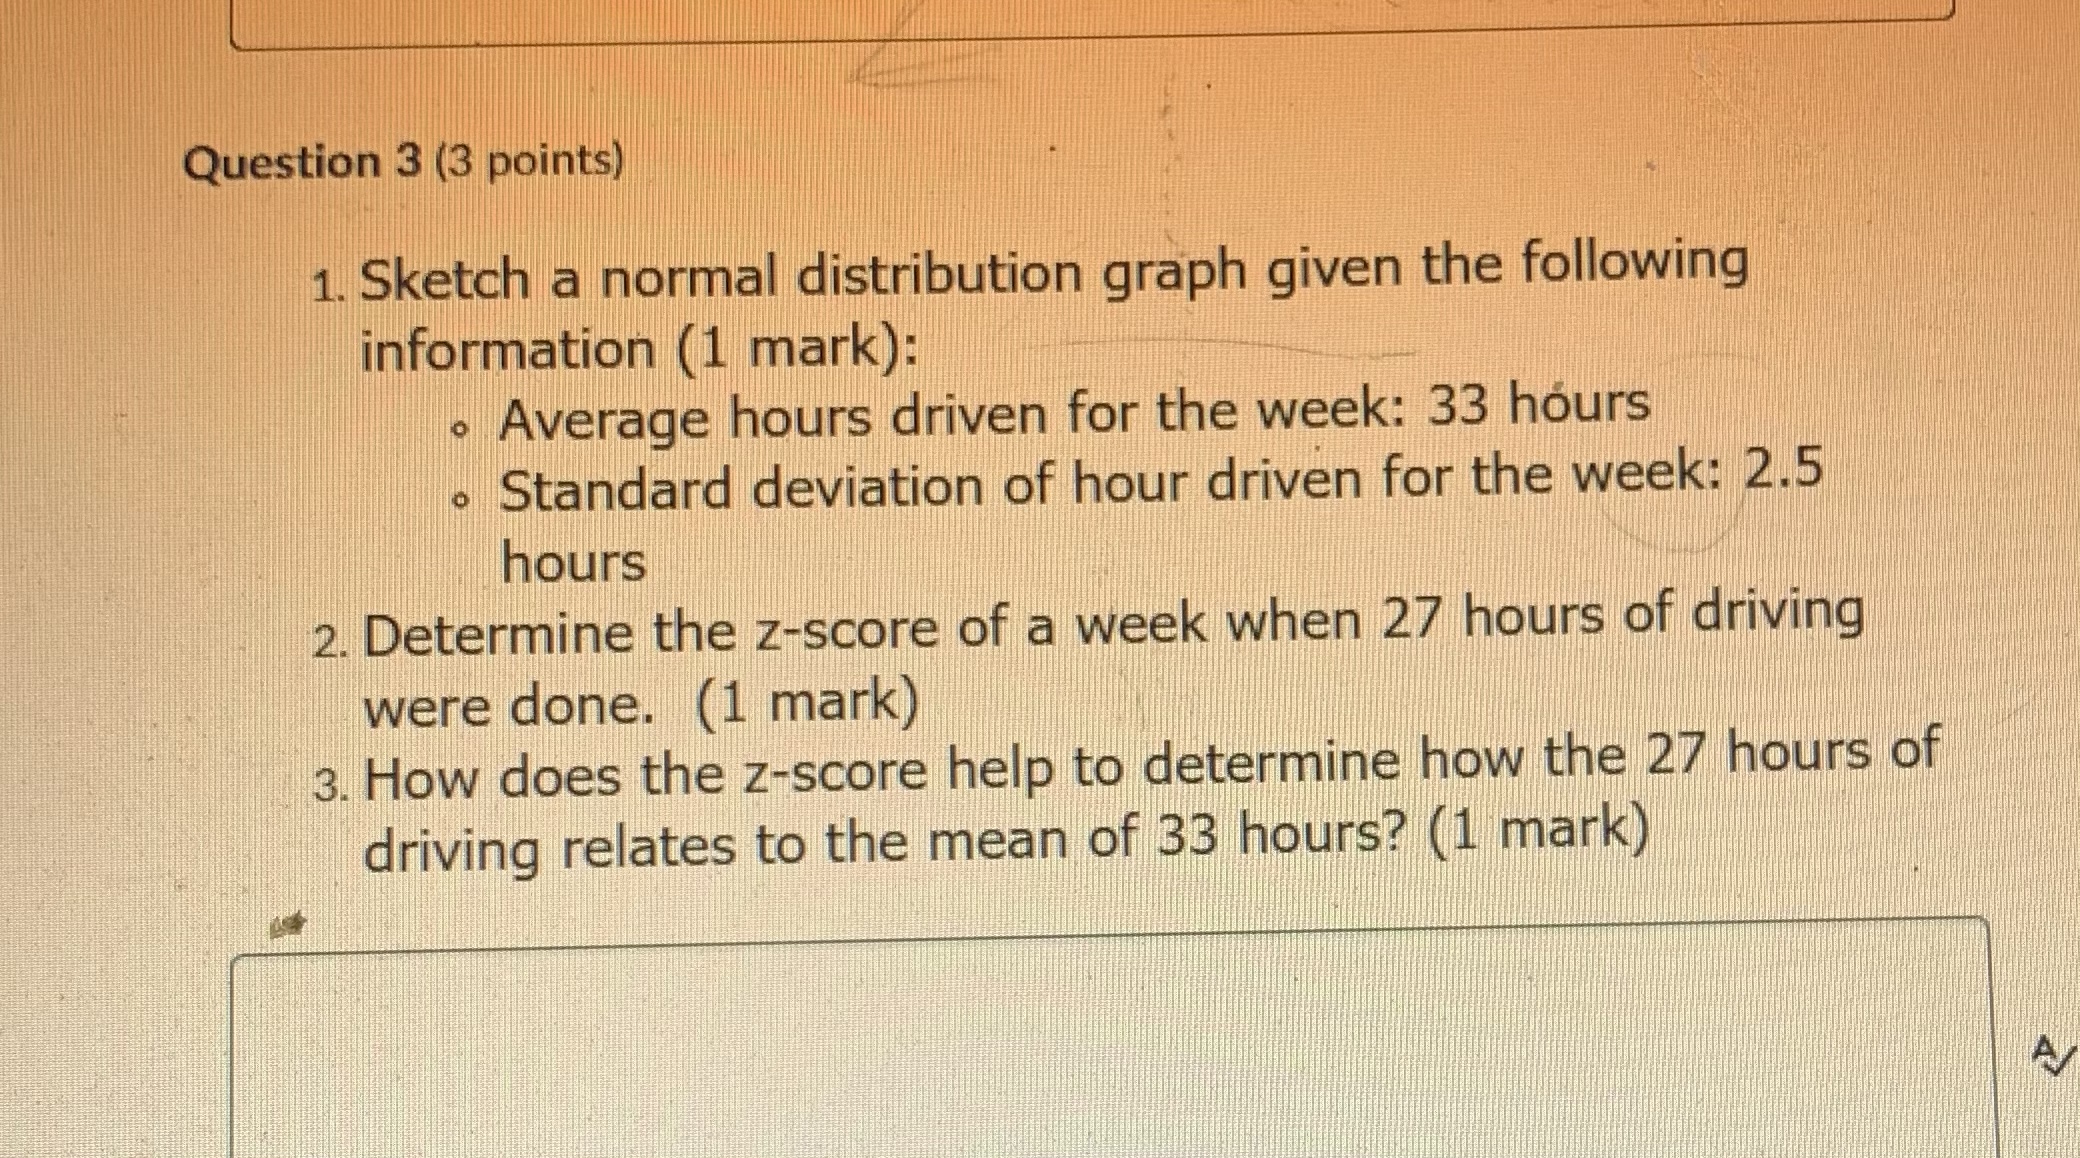
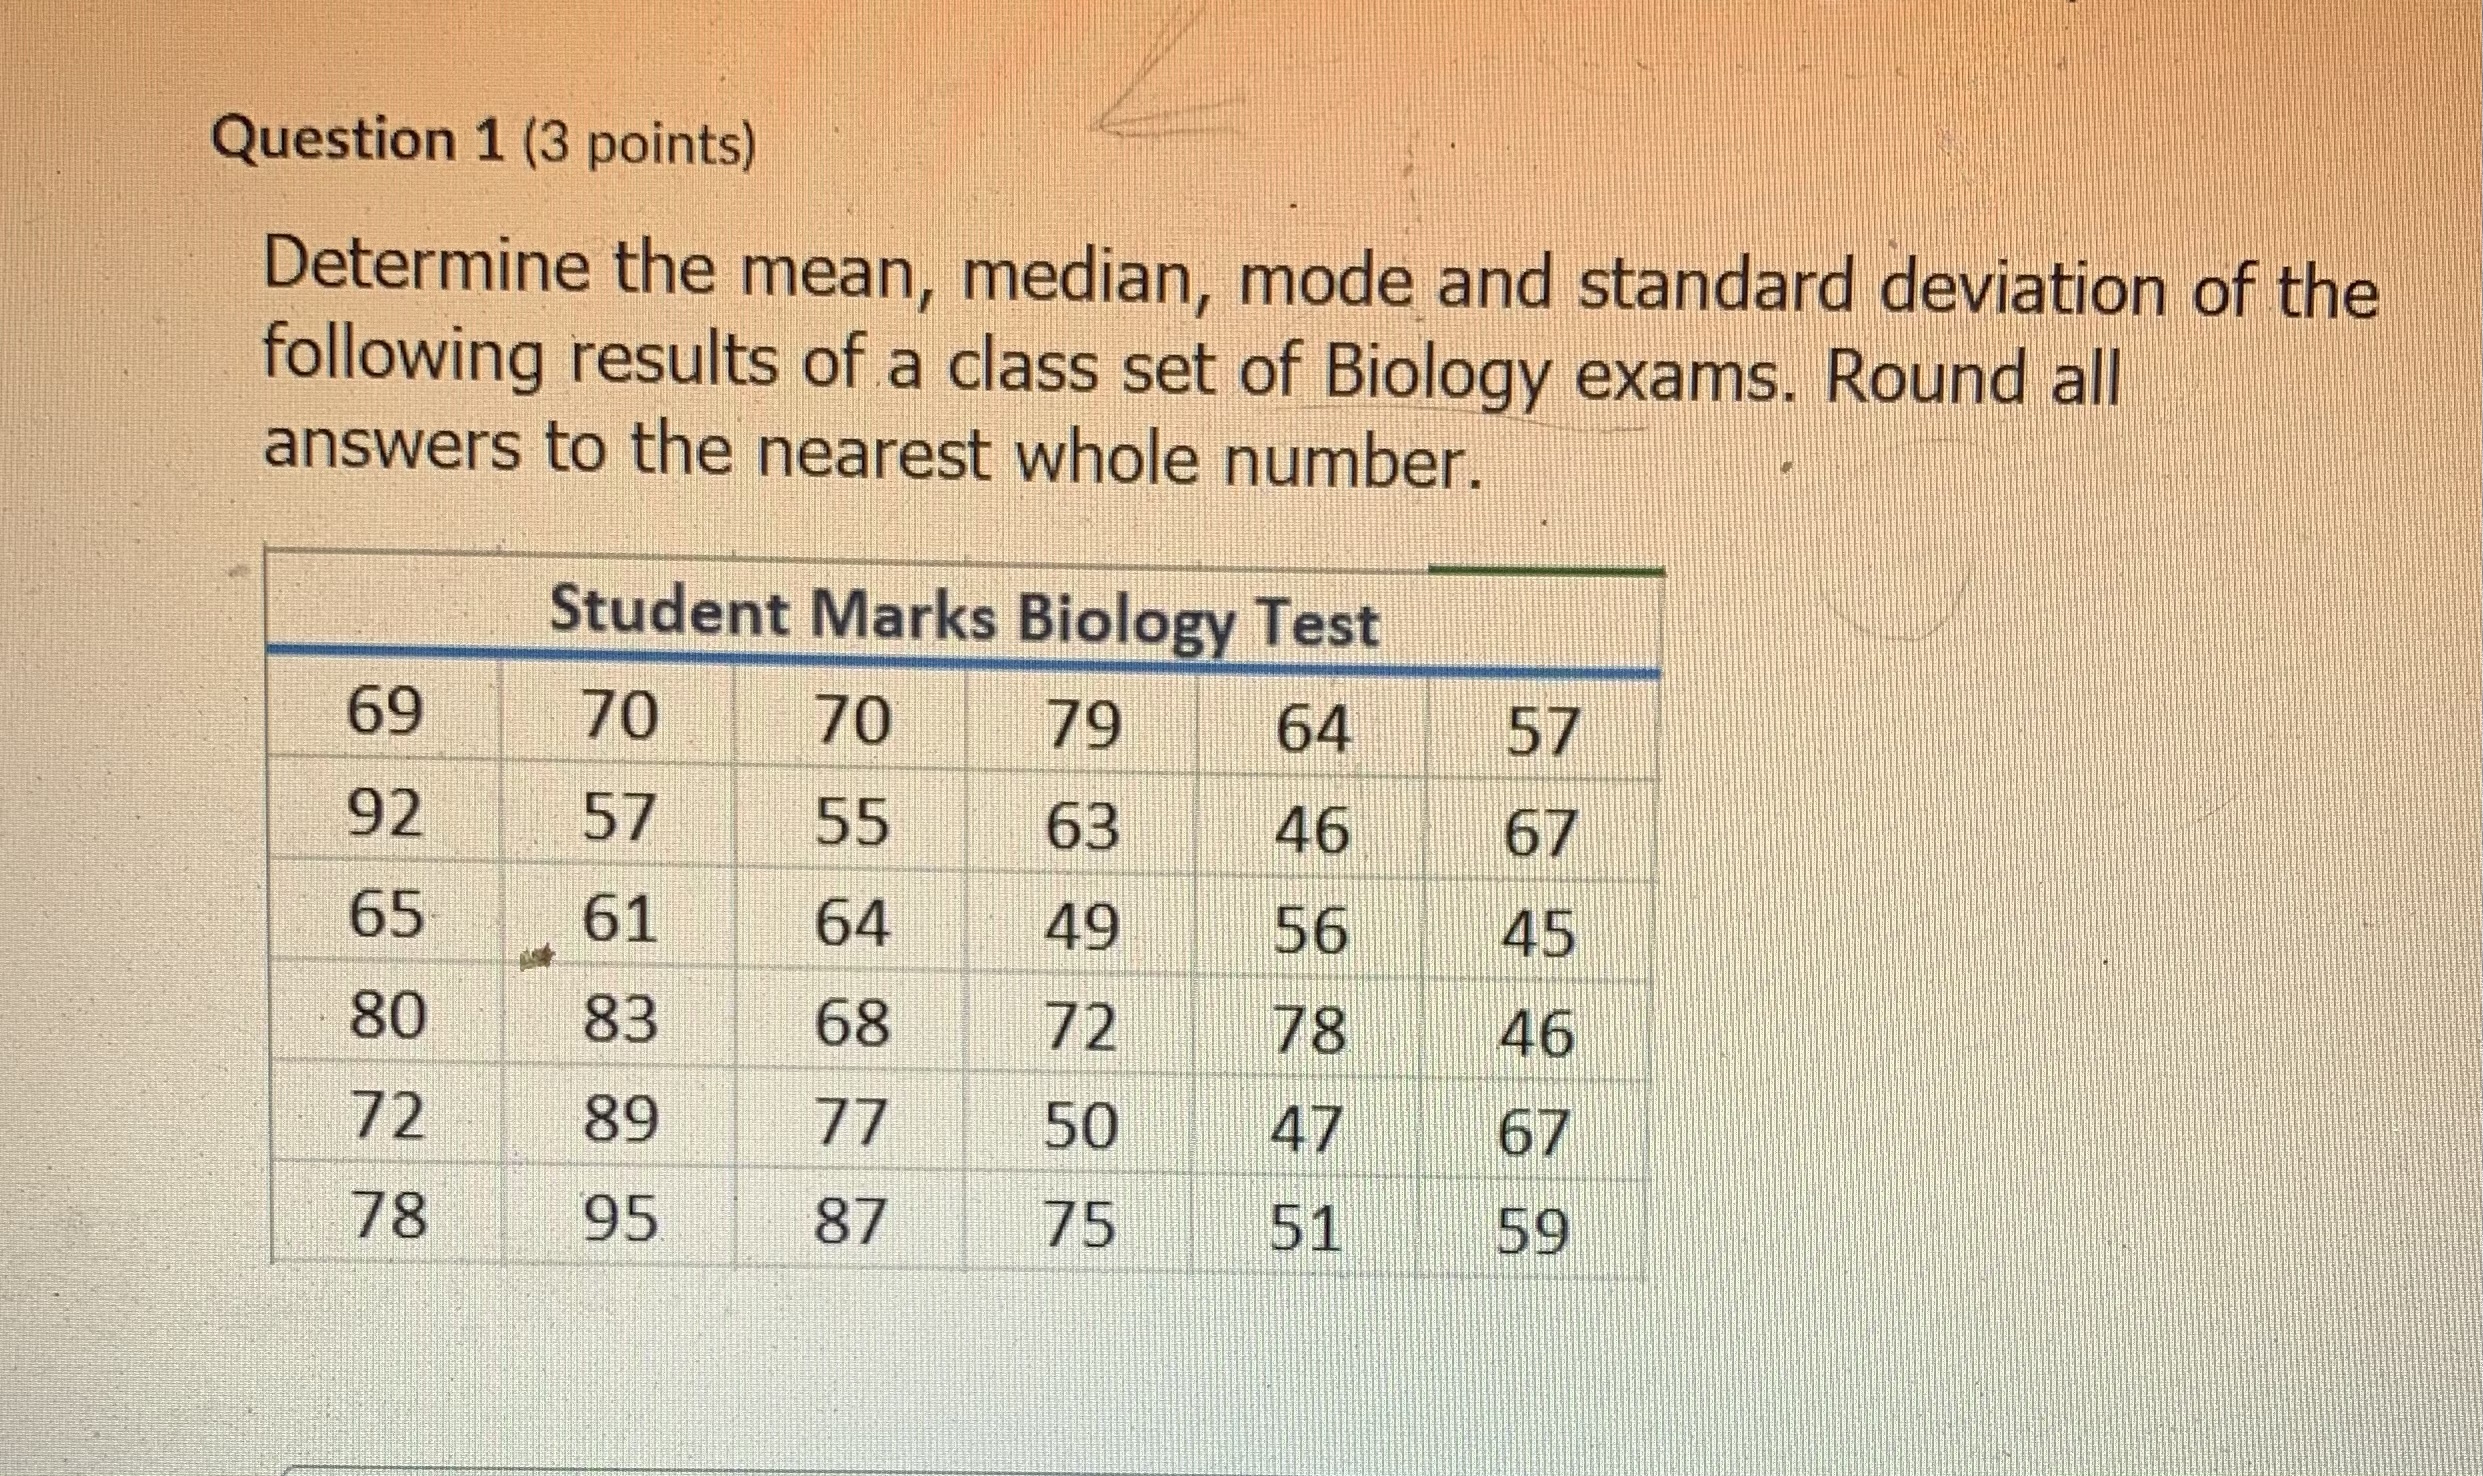
Question 3 (3 points) 1. Sketch a normal distribution graph given the following information (1 mark): . Average hours driven for the week: 33 hours . Standard deviation of hour driven for the week: 2.5 hours 2. Determine the z-score of a week when 27 hours of driving were done. (1 mark) 3. How does the z-score help to determine how the 27 hours of driving relates to the mean of 33 hours? (1 mark) AQuestion 1 (3 points) Determine the mean, median, mode and standard deviation of the following results of a class set of Biology exams. Round all answers to the nearest whole number. Student Marks Biology Test 69 70 70 79 64 57 92 57 55 63 46 67 65 61 64 49 56 45 80 83 68 72 78 46 72 89 77 50 47 67 78 95 87 75 51 59
Step by Step Solution
There are 3 Steps involved in it

Get step-by-step solutions from verified subject matter experts