

Question: statistics probability What To Do Written Work 1 Directions: Determine the region under the t-distribution corresponding to the indicated t-value by sketching the curve and
statistics probability
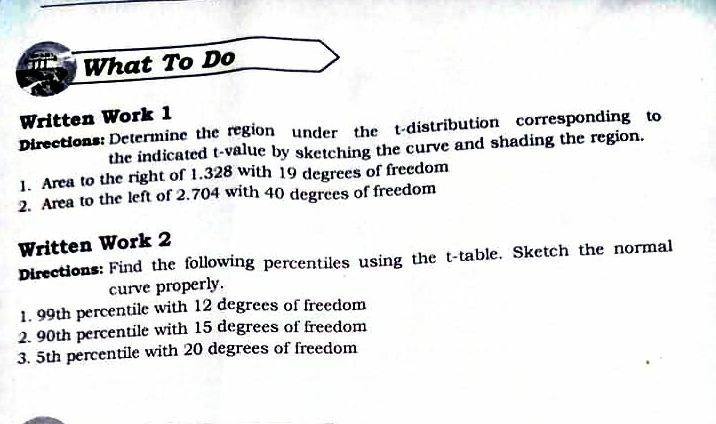
What To Do Written Work 1 Directions: Determine the region under the t-distribution corresponding to the indicated t-value by sketching the curve and shading the region. 1. Area to the right of 1.328 with 19 degrees of freedom 2. Area to the left of 2.704 with 40 degrees of freedom Written Work 2 Directions: Find the following percentiles using the t-table. Sketch the normal curve properly. 1. 99th percentile with 12 degrees of freedom 2. 90th percentile with 15 degrees of freedom 3. 5th percentile with 20 degrees of freedom
Step by Step Solution
There are 3 Steps involved in it
1 Expert Approved Answer
Step: 1 Unlock

Question Has Been Solved by an Expert!
Get step-by-step solutions from verified subject matter experts
Step: 2 Unlock
Step: 3 Unlock