

Question: Statistics and Probability 5 number summary: S 6 7 8 9 10 11 12 13 14 15 16 17 18 19 data Q Based on
Statistics and Probability
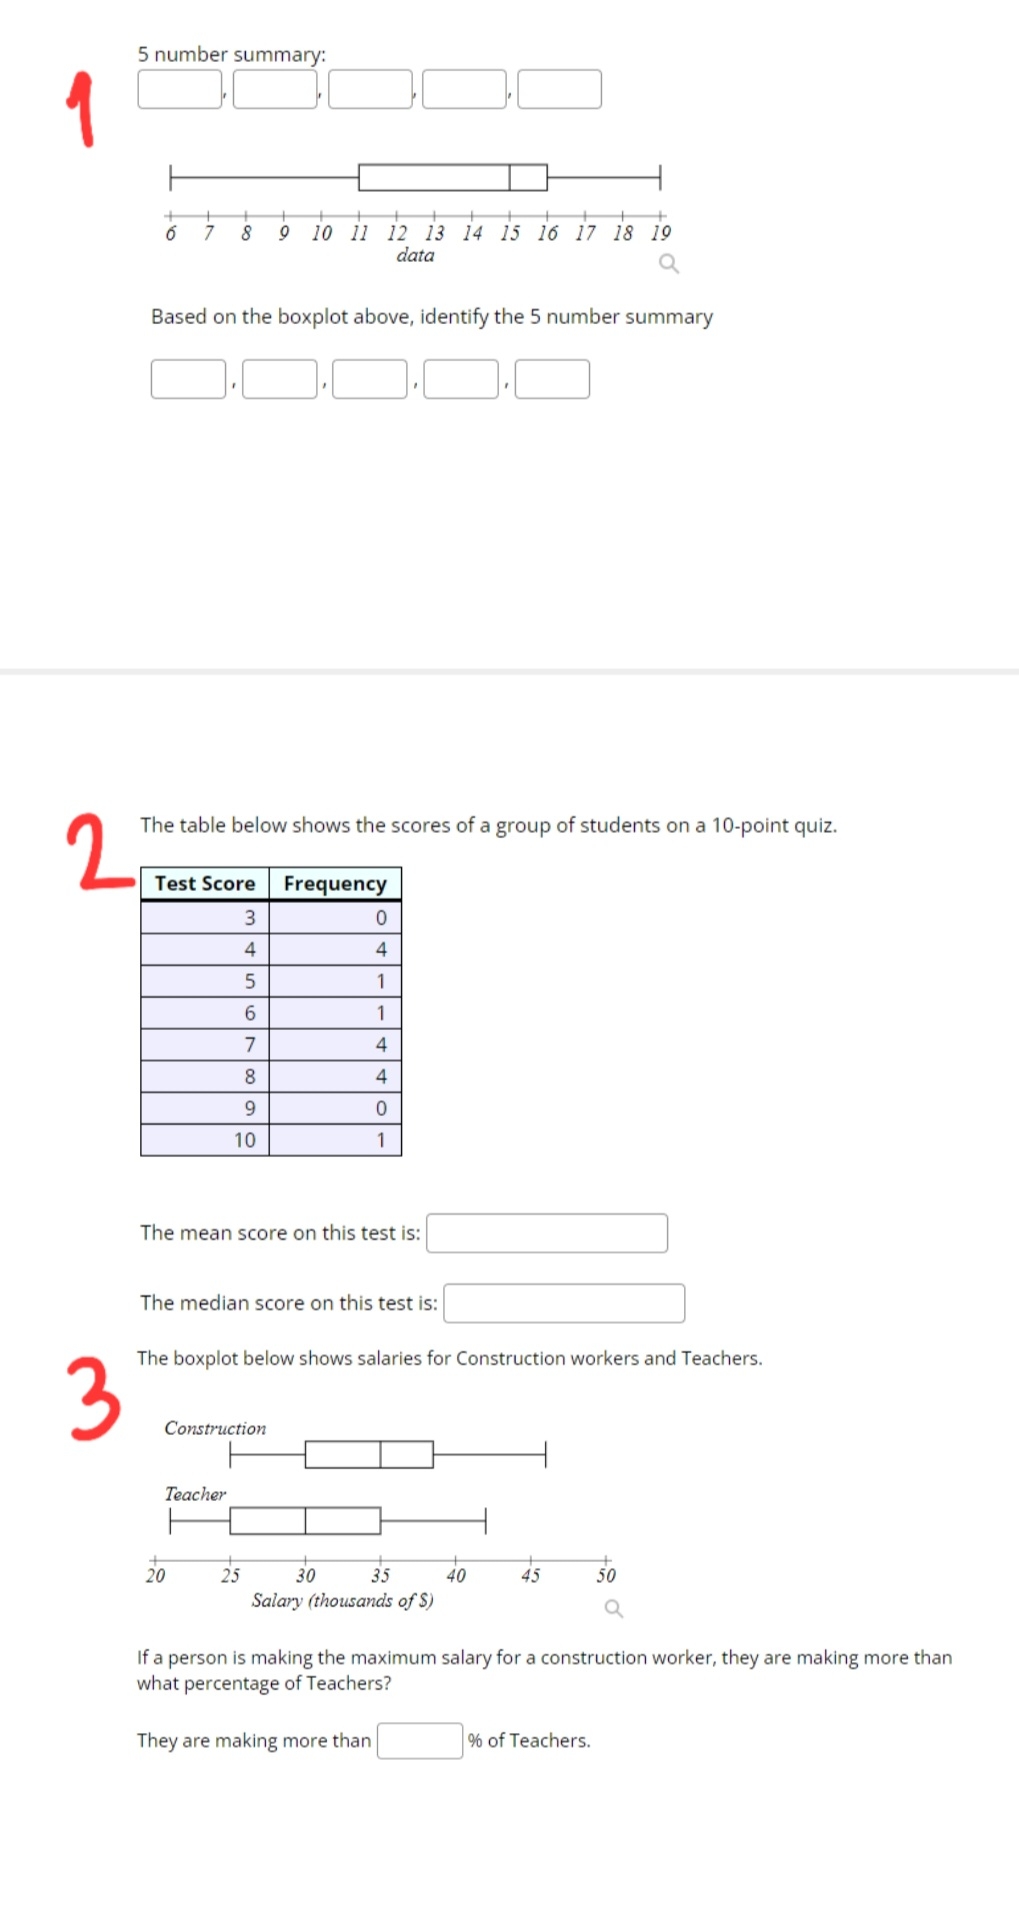
5 number summary: S 6 7 8 9 10 11 12 13 14 15 16 17 18 19 data Q Based on the boxplot above, identify the 5 number summary The table below shows the scores of a group of students on a 10-point quiz. N Test Score Frequency 3 0 4 1 1 LO OO V CI UI A 4 - O A 10 The mean score on this test is: The median score on this test is: The boxplot below shows salaries for Construction workers and Teachers. 3 Construction Teacher 20 25 30 35 40 45 50 Salary (thousands of $) Q If a person is making the maximum salary for a construction worker, they are making more than what percentage of Teachers? They are making more than % of Teachers
Step by Step Solution
There are 3 Steps involved in it

Get step-by-step solutions from verified subject matter experts