

Question: Statistics questions. Excel and Pivot tables. 6. (40 points) The database in the sheet BERKELEY illustrates Simpson's Paradox. (1) Put your LASTNAME in cell F1.
Statistics questions. Excel and Pivot tables.
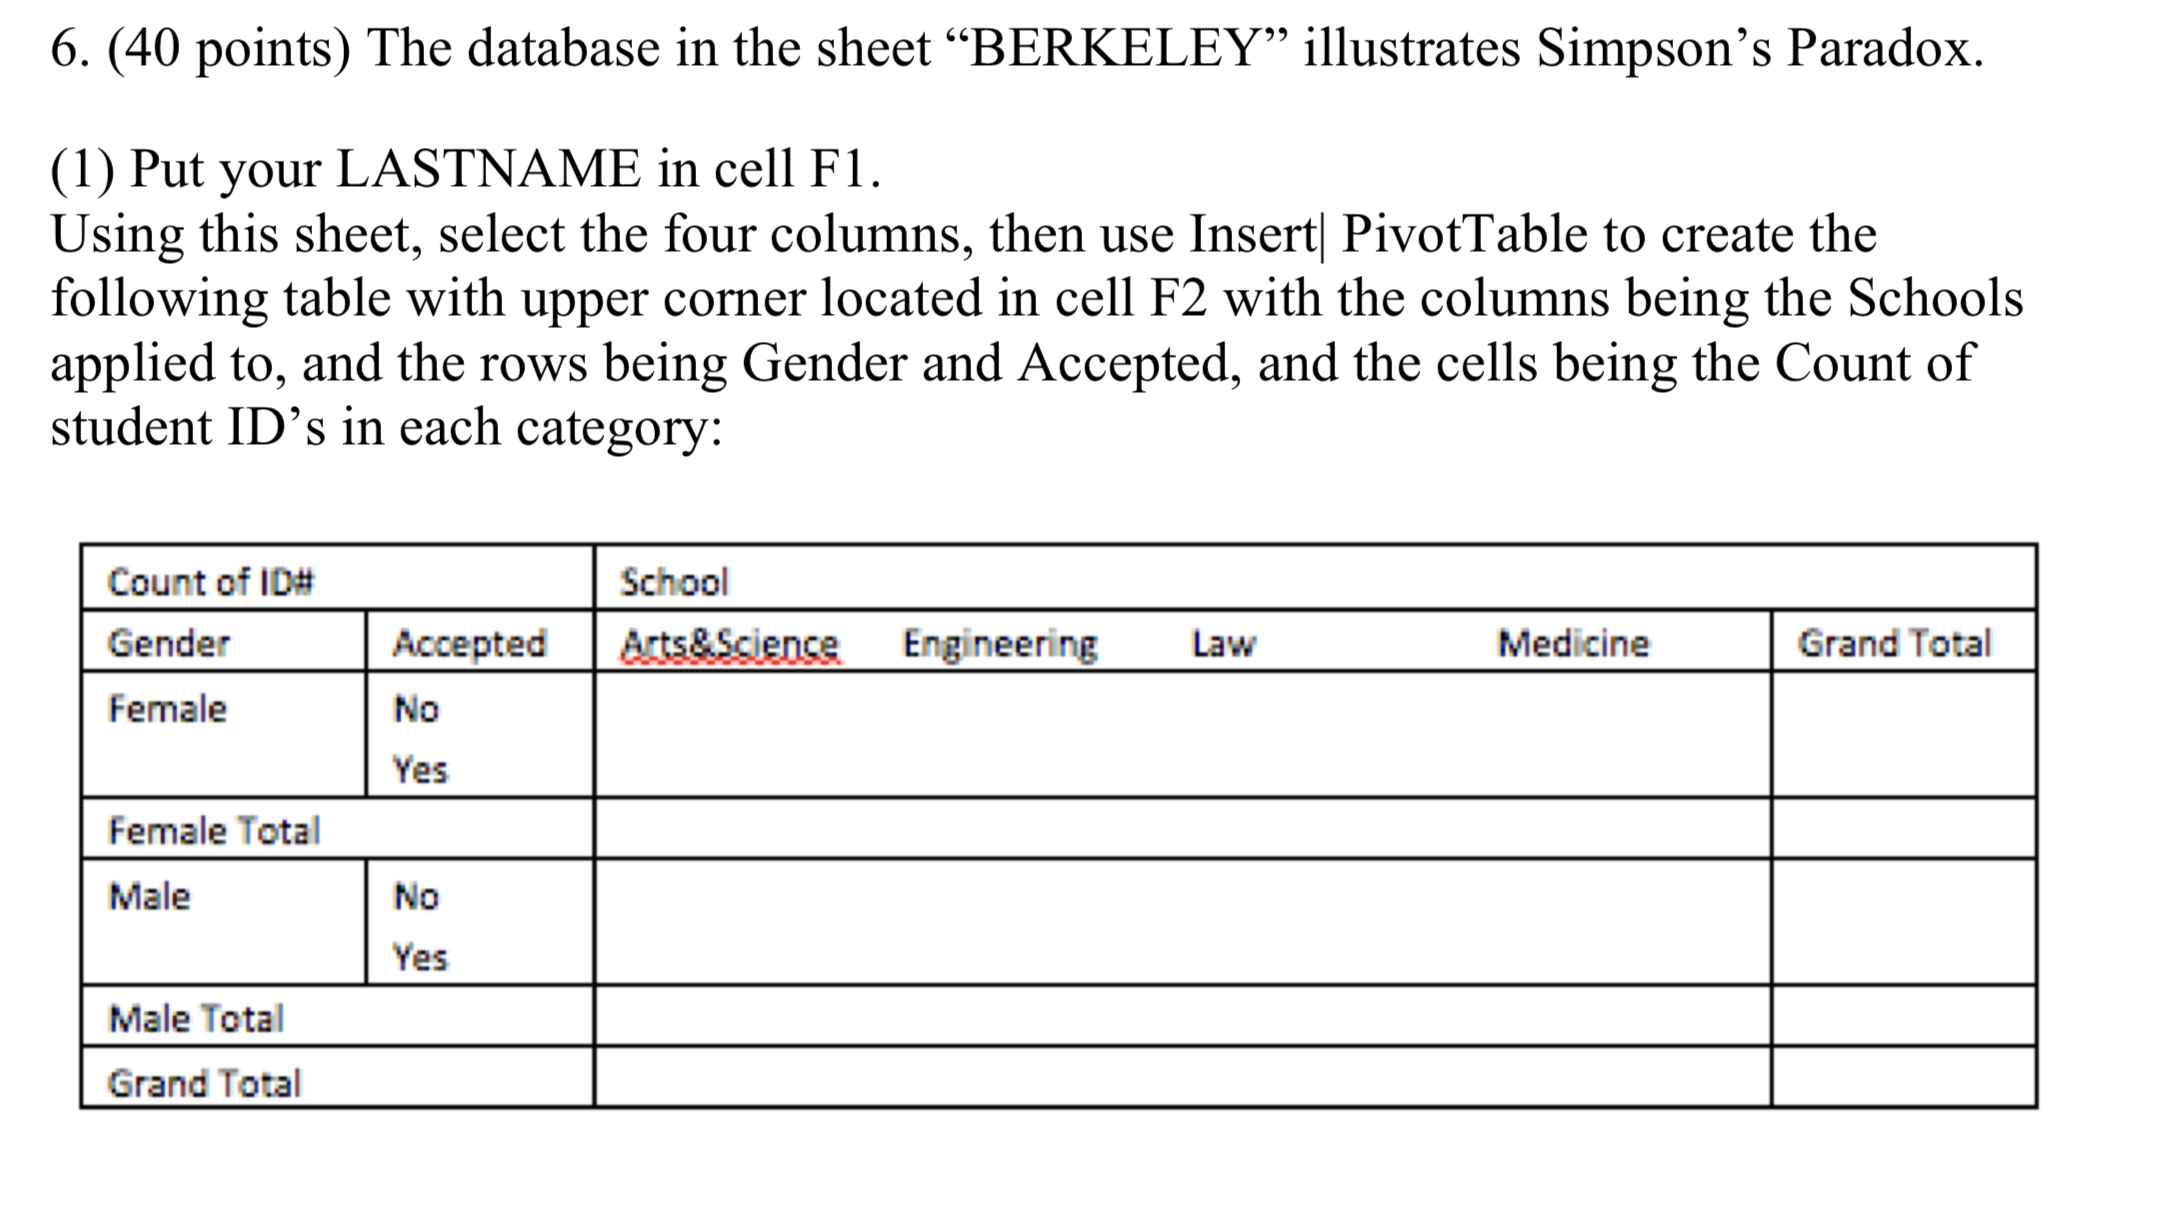
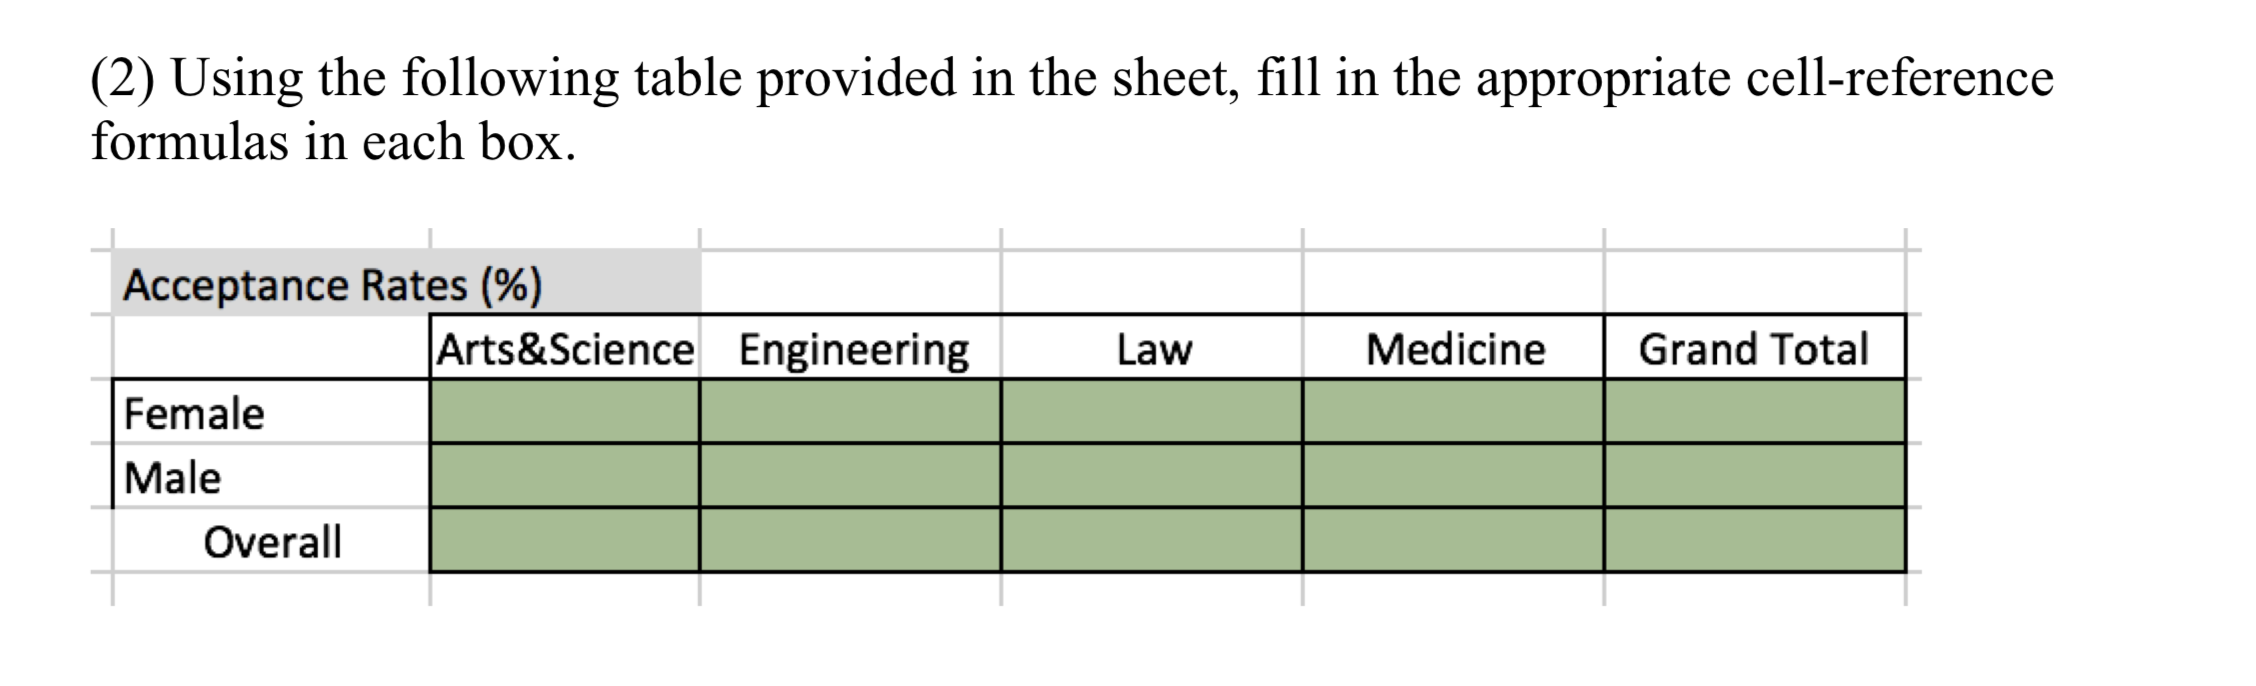
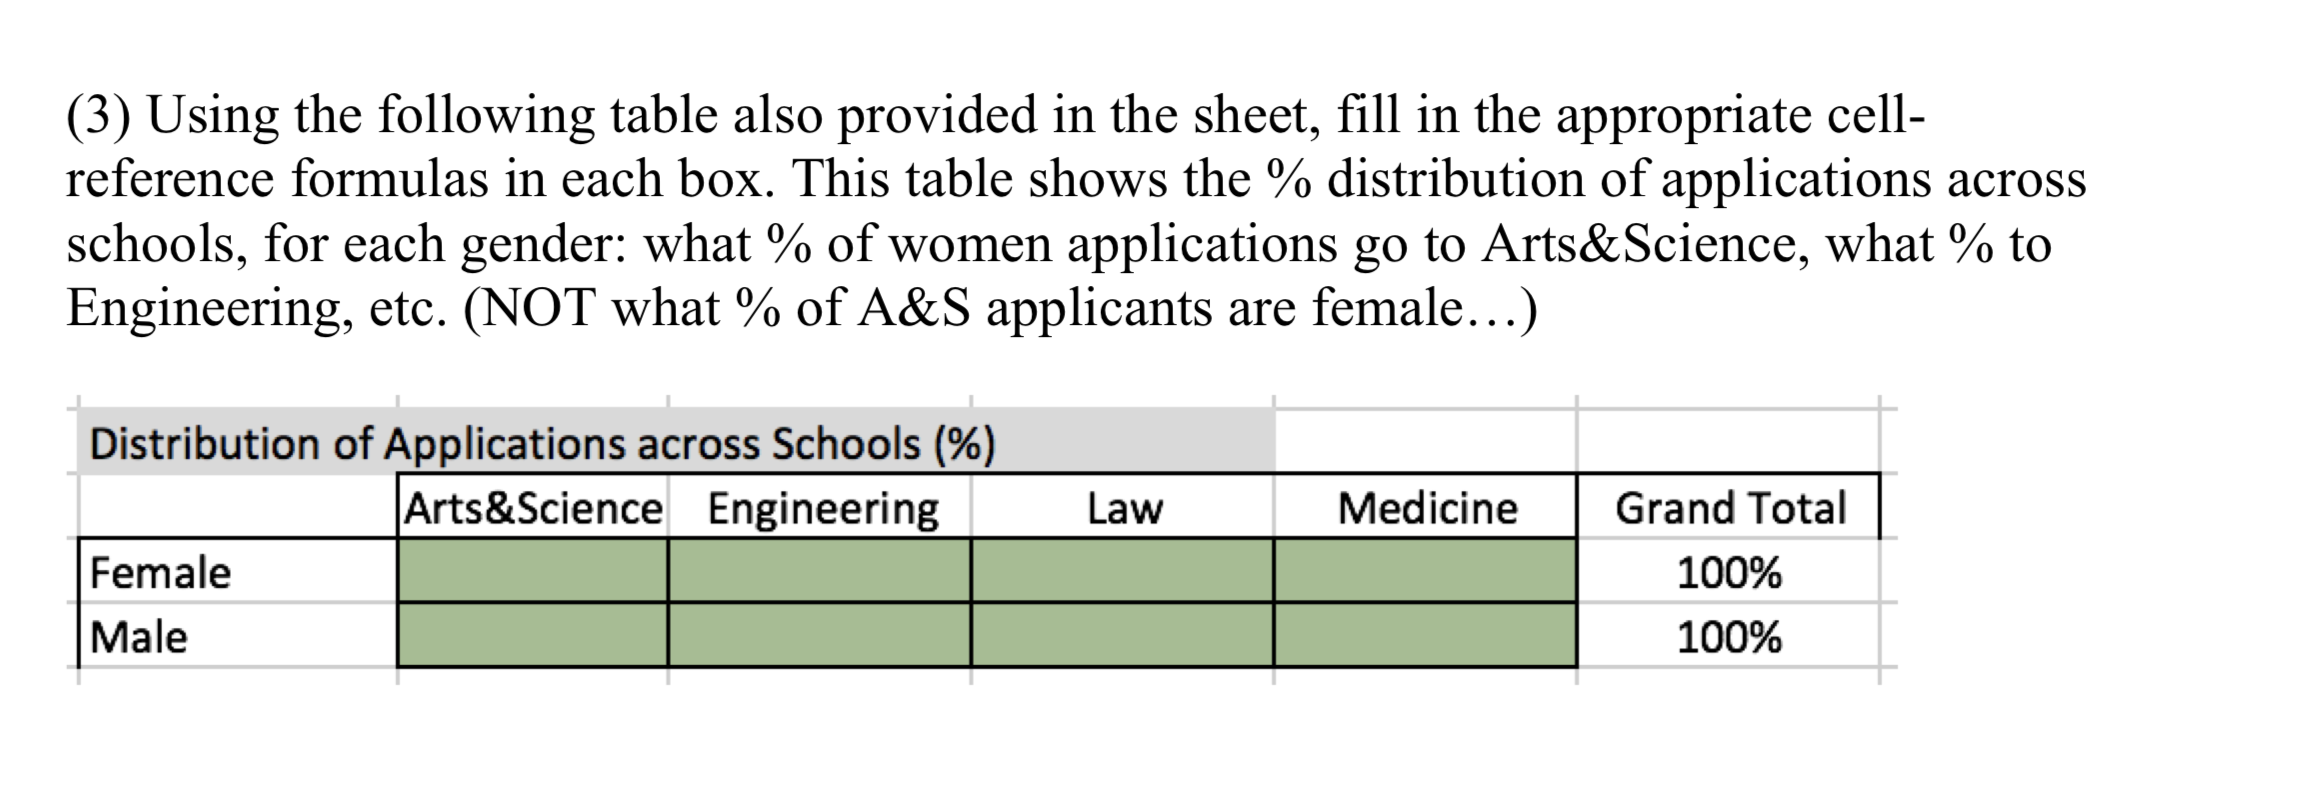

6. (40 points) The database in the sheet "BERKELEY" illustrates Simpson's Paradox. (1) Put your LASTNAME in cell F1. Using this sheet, select the four columns, then use Insert PivotTable to create the following table with upper corner located in cell F2 with the columns being the Schools applied to, and the rows being Gender and Accepted, and the cells being the Count of student ID's in each category: Count of ID# School Gender Accepted Arts& Science Engineering Law Medicine Grand Total Female No Yes Female Total Male No Yes Male Total Grand Total(2) Using the following table provided in the sheet, fill in the appropriate cell-reference formulas in each box. Acceptance Rates (%) Arts&Science Engineering Law Medicine Grand Total Female Male Overall(3) Using the following table also provided in the sheet, ll in the appropriate cell- reference formulas in each box. This table shows the % distribution of applications across schools, for each gender: what % of women applications go to Arts&Science, what % to Engineering, etc. (NOT what % of A&S applicants are female...) - - llcations across Schools (9'6) m Grand Total Distribution of (4) At the bottom of the above sheet, summarize in your own words (okay to handwrite) Why this data presents a paradox, why it occurs, and how it can be understood
Step by Step Solution
There are 3 Steps involved in it

Get step-by-step solutions from verified subject matter experts