

Question: Please explain. Need to use excel and pivot table. 6. (40 points) The database in the sheet BERKELEY illustrates Simpson's Paradox. (1) Put your LASTNAME
Please explain. Need to use excel and pivot table.
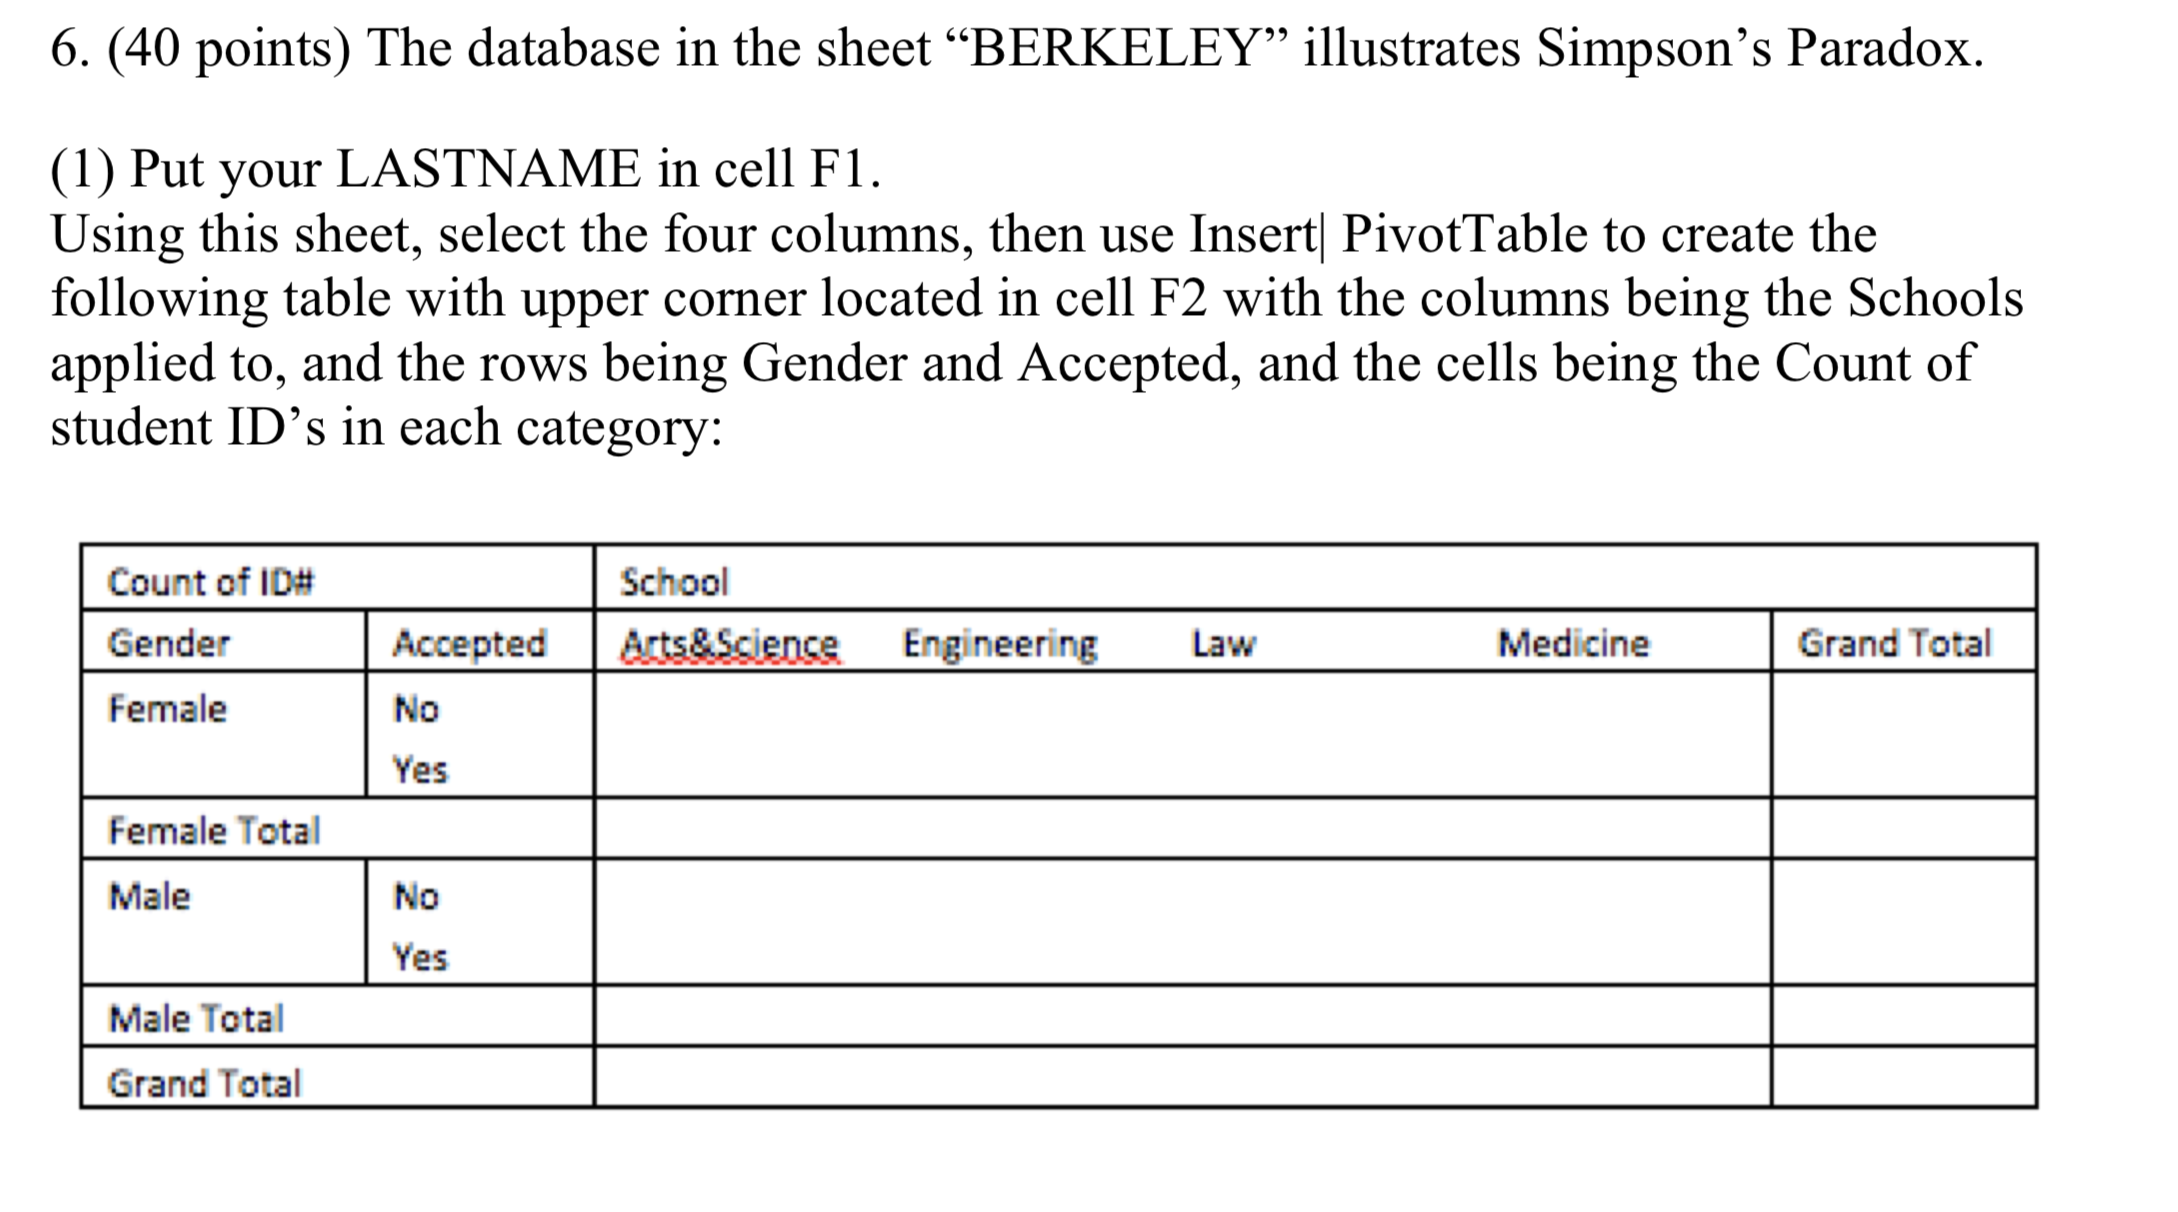
6. (40 points) The database in the sheet "BERKELEY" illustrates Simpson's Paradox. (1) Put your LASTNAME in cell F1. Using this sheet, select the four columns, then use Insert PivotTable to create the following table with upper corner located in cell F2 with the columns being the Schools applied to, and the rows being Gender and Accepted, and the cells being the Count of student ID's in each category: Count of ID# School Gender Accepted Arts& Science Engineering Law Medicine Grand Total Female No Yes Female Total Male No Yes Male Total Grand Total
Step by Step Solution
There are 3 Steps involved in it
1 Expert Approved Answer
Step: 1 Unlock

Question Has Been Solved by an Expert!
Get step-by-step solutions from verified subject matter experts
Step: 2 Unlock
Step: 3 Unlock