

Question: Statistics Questions Please use Math Reference.png as a resource for answering the questions below. Math Reference.png shows the correct answers for similar problems with different
Statistics Questions
Please use Math Reference.png as a resource for answering the questions below. Math Reference.png shows the correct answers for similar problems with different values. Refer to it while solving question 1 and 2 if necessary to ensure you get the correct answer.
Note
The correct answer for Question 1 Blank 4 was 170.635cm
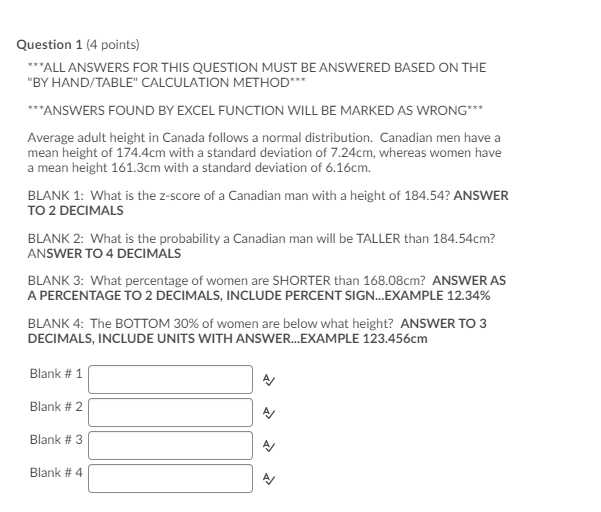
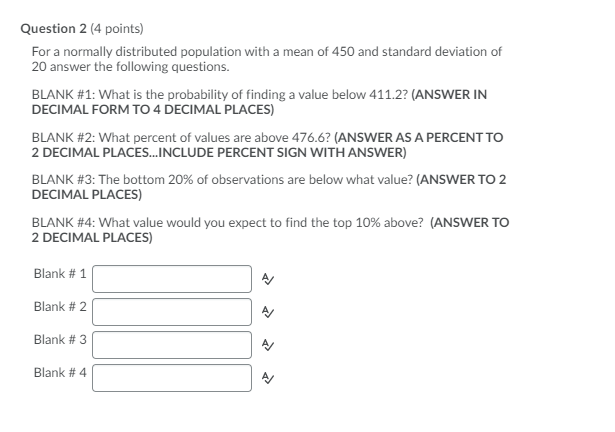
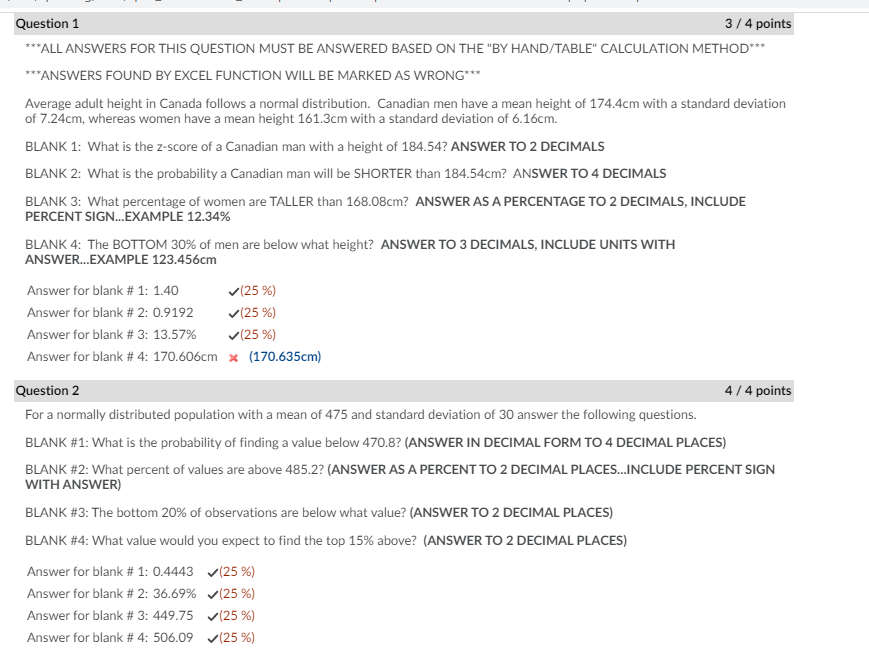
Question 1 (4 points) *ALL ANSWERS FOR THIS QUESTION MUST BE ANSWERED BASED ON THE "BY HAND/TABLE" CALCULATION METHOD*** *ANSWERS FOUND BY EXCEL FUNCTION WILL BE MARKED AS WRONG*** Average adult height in Canada follows a normal distribution. Canadian men have a mean height of 174.4cm with a standard deviation of 7.24cm, whereas women have a mean height 161.3cm with a standard deviation of 6.16cm. BLANK 1: What is the z-score of a Canadian man with a height of 184.54? ANSWER TO 2 DECIMALS BLANK 2: What is the probability a Canadian man will be TALLER than 184.54cm? ANSWER TO 4 DECIMALS BLANK 3: What percentage of women are SHORTER than 168.08cm? ANSWERAS A PERCENTAGE TO 2 DECIMALS, INCLUDE PERCENT SIGN..EXAMPLE 12.34% BLANK 4: The BOTTOM 30% of women are below what height? ANSWER TO 3 DECIMALS, INCLUDE UNITS WITH ANSWER..EXAMPLE 123.456cm Blank # 1 Blank # 2 A/ Blank # 3 Blank # 4 A/Question 2 (4 points) For a normally distributed population with a mean of 450 and standard deviation of 20 answer the following questions. BLANK #1: What is the probability of finding a value below 411.2? (ANSWER IN DECIMAL FORM TO 4 DECIMAL PLACES) BLANK #2: What percent of values are above 476.6? (ANSWER AS A PERCENT TO 2 DECIMAL PLACES..INCLUDE PERCENT SIGN WITH ANSWER) BLANK #3: The bottom 20% of observations are below what value? (ANSWER TO 2 DECIMAL PLACES) BLANK #4: What value would you expect to find the top 10% above? (ANSWER TO 2 DECIMAL PLACES) Blank # 1 Blank # 2 A/ Blank # 3 A Blank # 4Question 1 3 / 4 points *ALL ANSWERS FOR THIS QUESTION MUST BE ANSWERED BASED ON THE "BY HAND/TABLE" CALCULATION METHOD*** *ANSWERS FOUND BY EXCEL FUNCTION WILL BE MARKED AS WRONG*** Average adult height in Canada follows a normal distribution. Canadian men have a mean height of 174.4cm with a standard deviation of 7.24cm, whereas women have a mean height 161.3cm with a standard deviation of 6.16cm. BLANK 1: What is the z-score of a Canadian man with a height of 184.54? ANSWER TO 2 DECIMALS BLANK 2: What is the probability a Canadian man will be SHORTER than 184.54cm? ANSWER TO 4 DECIMALS BLANK 3: What percentage of women are TALLER than 168.08cm? ANSWER AS A PERCENTAGE TO 2 DECIMALS, INCLUDE PERCENT SIGN..EXAMPLE 12.34% BLANK 4: The BOTTOM 30% of men are below what height? ANSWER TO 3 DECIMALS, INCLUDE UNITS WITH ANSWER..EXAMPLE 123.456cm Answer for blank # 1: 1.40 (25 %) Answer for blank # 2: 0.9192 (25 %) Answer for blank # 3: 13.57% (25 %) Answer for blank # 4: 170.606cm x (170.635cm) Question 2 4 / 4 points For a normally distributed population with a mean of 475 and standard deviation of 30 answer the following questions. BLANK #1: What is the probability of finding a value below 470.8? (ANSWER IN DECIMAL FORM TO 4 DECIMAL PLACES) BLANK #2: What percent of values are above 485.2? (ANSWER AS A PERCENT TO 2 DECIMAL PLACES..INCLUDE PERCENT SIGN WITH ANSWER) BLANK #3: The bottom 20% of observations are below what value? (ANSWER TO 2 DECIMAL PLACES) BLANK #4: What value would you expect to find the top 15% above? (ANSWER TO 2 DECIMAL PLACES) Answer for blank # 1: 0.4443 (25 %) Answer for blank # 2: 36.69% (25 %) Answer for blank # 3: 449.75 (25 %) Answer for blank # 4: 506.09 (25 %)
Step by Step Solution
There are 3 Steps involved in it

Get step-by-step solutions from verified subject matter experts