

Question: STATISTICS! STATISTICS! STATISTICS! The data given to the right includes data from 40 candies, and 7 of them are red. The company that makes the
STATISTICS! STATISTICS! STATISTICS!
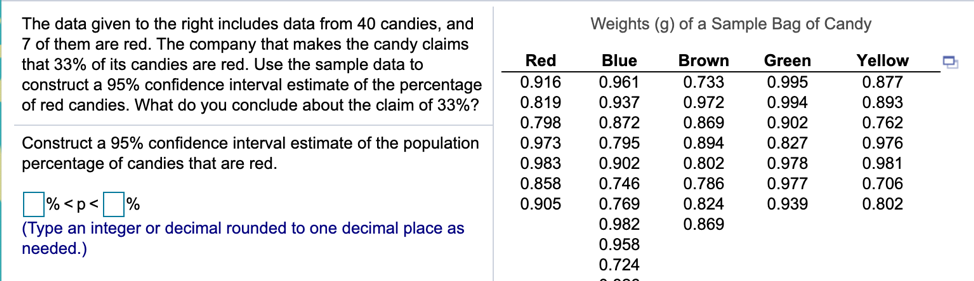
The data given to the right includes data from 40 candies, and 7 of them are red. The company that makes the candy claims Weights (g) of a Sample Bag of Candy that 33% of its candies are red. Use the sample data to Red Blue Brown Green Yellow construct a 95% confidence interval estimate of the percentage 0.916 0.961 0.733 0.995 0.877 of red candies. What do you conclude about the claim of 33%? 0.819 0.937 0.972 0.994 0.893 0.798 0.872 0.869 0.902 0.762 Construct a 95% confidence interval estimate of the population 0.973 0.795 0.894 0.827 0.976 percentage of candies that are red. 0.983 0.902 0.802 0.978 0.981 %
Step by Step Solution
There are 3 Steps involved in it
1 Expert Approved Answer
Step: 1 Unlock

Question Has Been Solved by an Expert!
Get step-by-step solutions from verified subject matter experts
Step: 2 Unlock
Step: 3 Unlock