

Question: The data given to the right includes data from 40 candies, and 5 of them are red. The company that makes the candy claims that

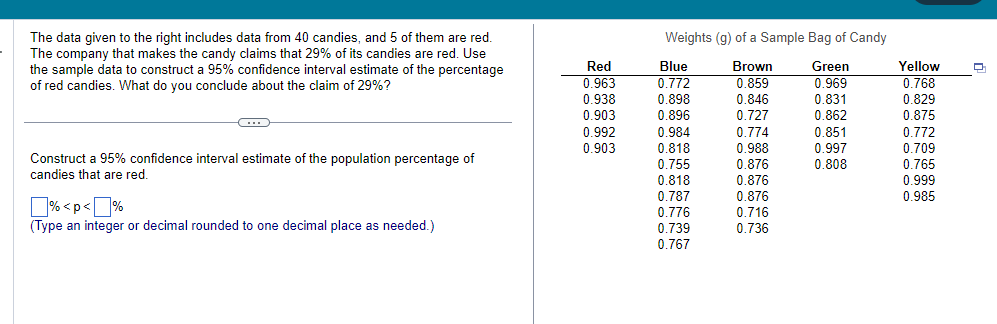
The data given to the right includes data from 40 candies, and 5 of them are red. The company that makes the candy claims that 29% of its candies are red. Use Weights (g) of a Sample Bag of Candy the sample data to construct a 95% confidence interval estimate of the percentage Red Blue Brown Green Yellow of red candies. What do you conclude about the claim of 29%? 0.963 0.772 0.859 0.969 0.768 0.938 0.898 0.846 0.831 0.829 0.903 0.896 0.727 0.862 0.875 0.992 0.984 0.774 0.851 0.772 Construct a 95% confidence interval estimate of the population percentage of 0.903 0.818 0.988 0.997 0.709 candies that are red. 0.755 0.876 0.808 0.765 0.818 0.876 0.999 %
Step by Step Solution
There are 3 Steps involved in it

Get step-by-step solutions from verified subject matter experts