

Question: statistics using technology textbook 2.2.3 homework problem 2 Complete 2.2.3 Homework Problem 2. Notice that the variable of interest is y2018 and the data set
statistics using technology textbook 2.2.3 homework problem 2
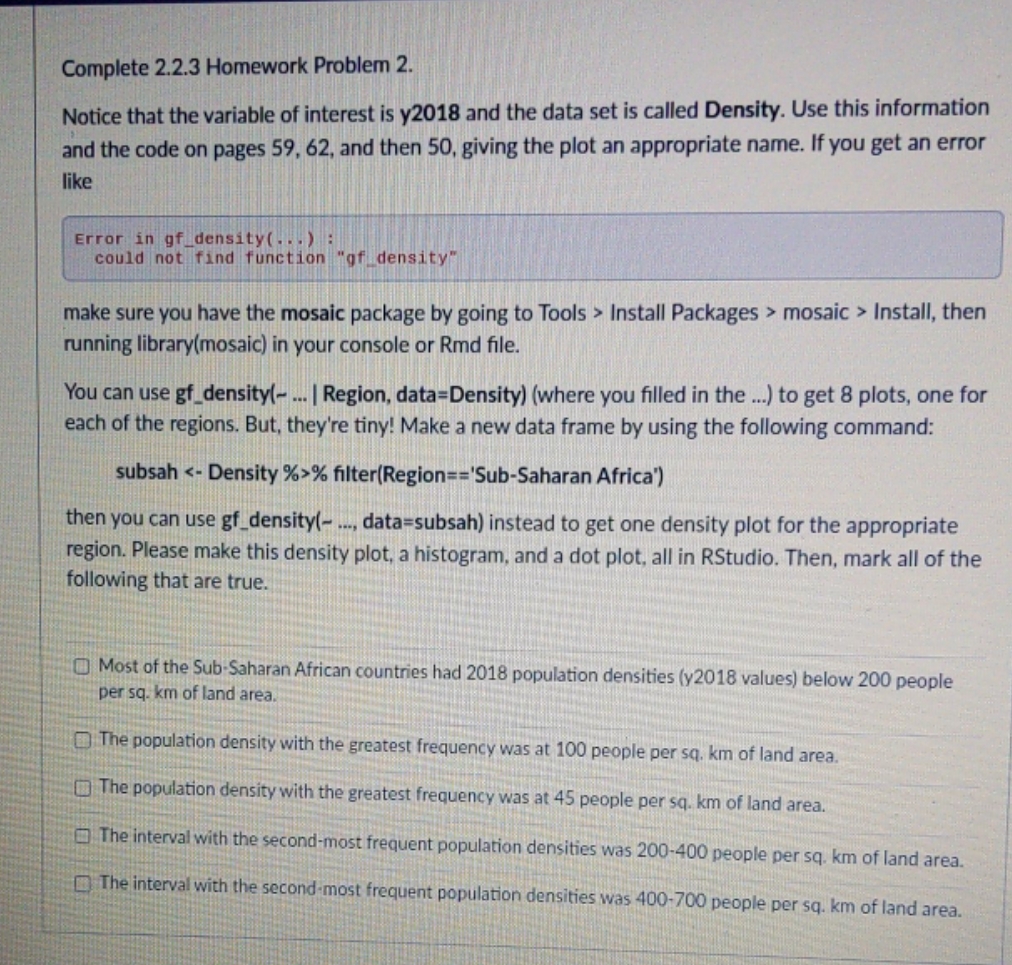
Complete 2.2.3 Homework Problem 2. Notice that the variable of interest is y2018 and the data set is called Density. Use this information and the code on pages 59, 62, and then 50, giving the plot an appropriate name. If you get an error like Error in of_density(. . .) could not find function "of_density" make sure you have the mosaic package by going to Tools > Install Packages > mosaic > Install, then running library(mosaic) in your console or Rmd file. You can use gf_density(- ... | Region, data=Density) (where you filled in the ..) to get 8 plots, one for each of the regions. But, they're tiny! Make a new data frame by using the following command: subsah % filter(Region=='Sub-Saharan Africa") then you can use gf_density(- ..., data=subsah) instead to get one density plot for the appropriate region. Please make this density plot, a histogram, and a dot plot, all in RStudio. Then, mark all of the following that are true. Most of the Sub-Saharan African countries had 2018 population densities (y2018 values) below 200 people per sq. km of land area. The population density with the greatest frequency was at 100 people per sq. km of land area. The population density with the greatest frequency was at 45 people per sq. km of land area. The interval with the second-most frequent population densities was 200-400 people per sq. km of land area. )The interval with the second-most frequent population densities was 400-700 people per sq. km of land area
Step by Step Solution
There are 3 Steps involved in it

Get step-by-step solutions from verified subject matter experts