

Question: statistics using technology textbook 2.3.3 homework problem 8 Complete 2.3.3 Homework Problem 8. Notice that the time variable is year and the other variables are
statistics using technology textbook 2.3.3 homework problem 8
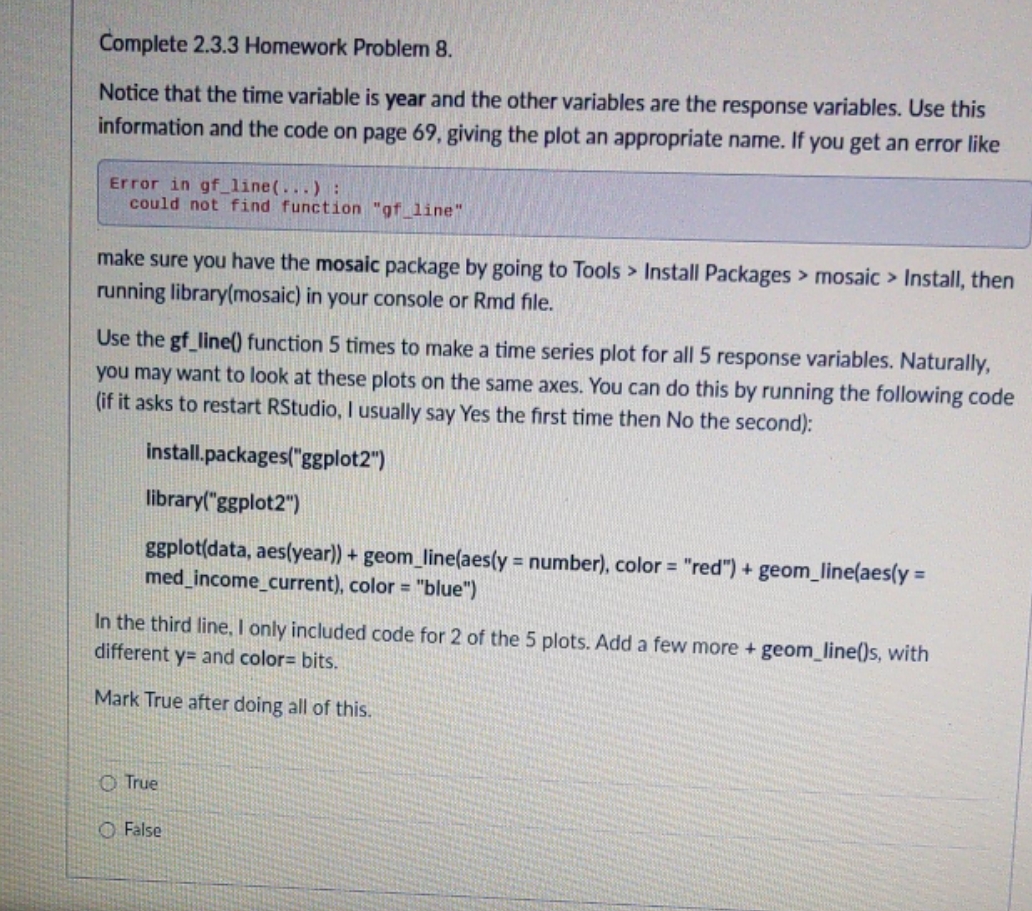
Complete 2.3.3 Homework Problem 8. Notice that the time variable is year and the other variables are the response variables. Use this information and the code on page 69, giving the plot an appropriate name. If you get an error like Error in gf_line( . . . ) : could not find function "of_line" make sure you have the mosaic package by going to Tools > Install Packages > mosaic > Install, then running library(mosaic) in your console or Rmd file. Use the gf_line() function 5 times to make a time series plot for all 5 response variables. Naturally, you may want to look at these plots on the same axes. You can do this by running the following code (if it asks to restart RStudio, I usually say Yes the first time then No the second): install.packages("ggplot2") library("ggplot2") ggplot(data, aes(year)) + geom_line(aes(y = number), color = "red") + geom_line(aes(y = med_income_current), color = "blue") In the third line, I only included code for 2 of the 5 plots. Add a few more + geom_line()s, with different y= and color= bits. Mark True after doing all of this. True False
Step by Step Solution
There are 3 Steps involved in it

Get step-by-step solutions from verified subject matter experts