

Question: statististical quality control question. please try to do this in microsoft exell. thanks The following number of defective parts was collected on fifteen samples and
statististical quality control question. please try to do this in microsoft exell. thanks 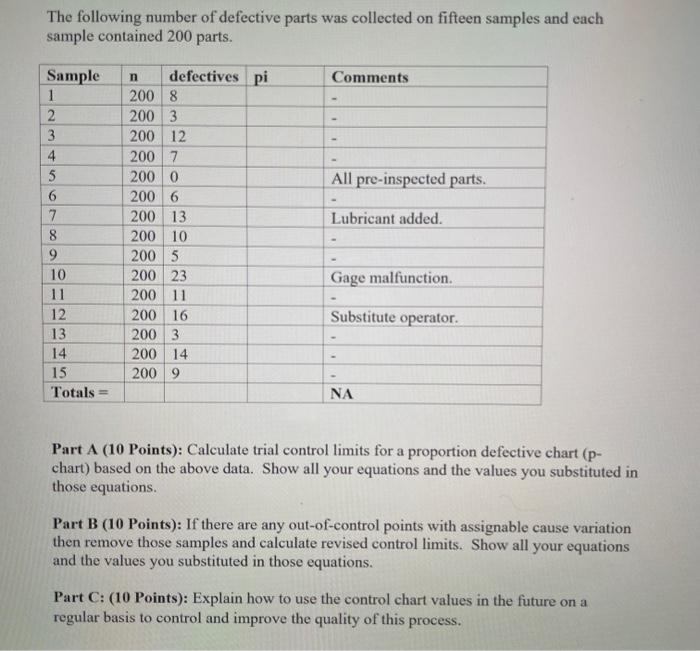
The following number of defective parts was collected on fifteen samples and each sample contained 200 parts. Comments All pre-inspected parts. Sample 1 2 3 4 5 6 7 8 9 10 11 12 13 14 15 Totals n defectives pi 200 8 200 3 200 12 2007 2000 200 6 200 13 200 10 200 5 200 23 200 11 200 16 200 3 200 14 200 9 Lubricant added Gage malfunction. Substitute operator. NA Part A (10 Points): Calculate trial control limits for a proportion defective chart (p- chart) based on the above data. Show all your equations and the values you substituted in those equations. Part B (10 Points): If there are any out-of-control points with assignable cause variation then remove those samples and calculate revised control limits. Show all your equations and the values you substituted in those equations. Part C: (10 Points): Explain how to use the control chart values in the future on a regular basis to control and improve the quality of this process Step by Step Solution
There are 3 Steps involved in it
1 Expert Approved Answer
Step: 1 Unlock

Question Has Been Solved by an Expert!
Get step-by-step solutions from verified subject matter experts
Step: 2 Unlock
Step: 3 Unlock