

Question: Statitics & Probability:- A quality control engineer conducted an experiment to investigate the effect of experience on an assembly line in terms of the average


Statitics & Probability:-
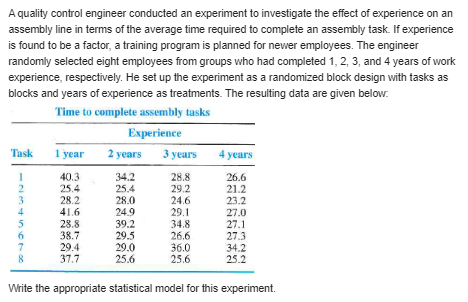
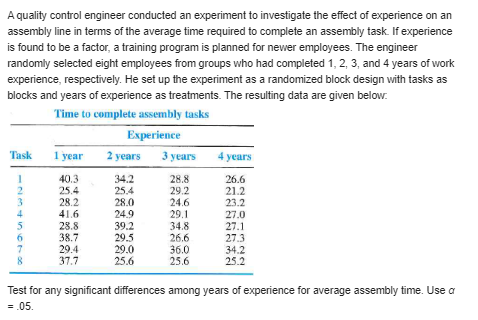
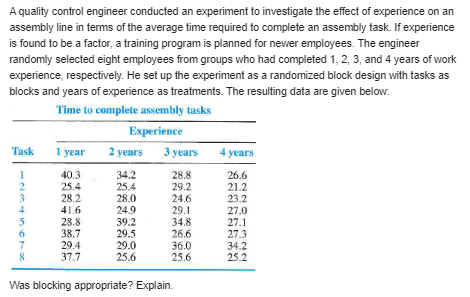
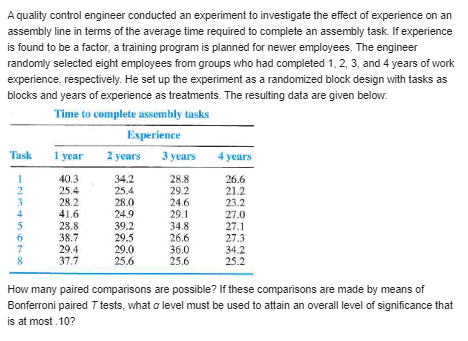

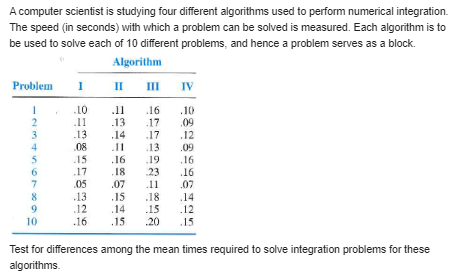

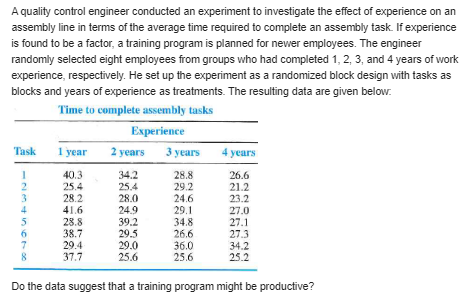
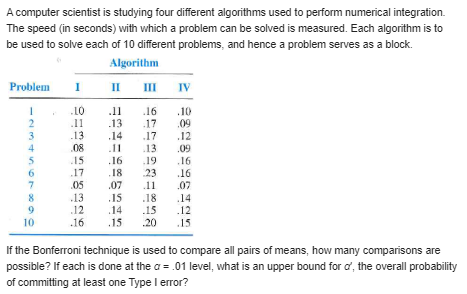
A quality control engineer conducted an experiment to investigate the effect of experience on an assembly line in terms of the average time required to complete an assembly task. If experience is found to be a factor, a training program is planned for newer employees. The engineer randomly selected eight employees from groups who had completed 1, 2, 3, and 4 years of work experience, respectively. He set up the experiment as a randomized block design with tasks as blocks and years of experience as treatments. The resulting data are given below. Time to complete assembly tasks Experience Task 1 year 2 years 3 years 4 years 40,3 34.2 28.8 26.6 25.4 25.4 29.2 21.2 28 2 28.0 24.6 23.2 41.6 24.9 29.1 27.0 23.8 39.2 34.8 27.1 38. 29.5 26.6 27.3 20.4 29.0 36.0 34.2 37.7 25.6 25.6 25.2 Write the appropriate statistical model for this experiment.A quality control engineer conducted an experiment to investigate the effect of experience on an assembly line in terms of the average time required to complete an assembly task. If experience is found to be a factor, a training program is planned for newer employees. The engineer randomly selected eight employees from groups who had completed 1, 2, 3, and 4 years of work experience, respectively. He set up the experiment as a randomized block design with tasks as blocks and years of experience as treatments. The resulting data are given below. Time to complete assembly tasks Experience Task 1 year 2 years 3 years 4 years 40,3 34.2 28.8 26.6 25.4 25.4 29.2 21.2 28. 2 280 24.6 23.2 41.6 249 29.1 27.0 23. 39.2 34.8 27.1 38.7 29 5 26.6 27.3 29.4 29.0 36.0 34.2 37.7 25.6 25.6 25.2 Test for any significant differences among years of experience for average assembly time. Use a = .05.A quality control engineer conducted an experiment to investigate the effect of experience on an assembly line in terms of the average time required to complete an assembly task. If experience is found to be a factor, a training program is planned for newer employees. The engineer randomly selected eight employees from groups who had completed 1, 2, 3, and 4 years of work experience, respectively. He set up the experiment as a randomized block design with tasks as blocks and years of experience as treatments. The resulting data are given below. Time to complete assembly tasks Experience Task 1 year 2 years 3 years 4 years 40,3 34.2 28.8 26.6 254 25.4 29.2 21.2 28.0 24.6 23.2 41.6 249 29.1 27.0 3.8 30 34.8 27.1 3 29 5 26.6 27.3 20.4 29.0 36.0 34.2 37.7 25.6 25.6 25.2 Was blocking appropriate? Explain.A quality control engineer conducted an experiment to investigate the effect of experience on an assembly line in terms of the average time required to complete an assembly task. If experience is found to be a factor, a training program is planned for newer employees. The engineer randomly selected eight employees from groups who had completed 1, 2, 3, and 4 years of work experience, respectively. He set up the experiment as a randomized block design with tasks as blocks and years of experience as treatments. The resulting data are given below. Time to complete assembly tusks Experience Task 1 year 1 years 3 years 4 years 40,3 34.2 28.8 26.6 25.4 25.4 29.2 21.2 28.2 28.0 24.6 23.2 41.6 24.9 29.1 27.0 28.8 39.2 34.8 27.1 38.7 29.5 26.6 27.3 20.4 20.0 36.0 34.2 37.7 25.6 25.6 25.2 How many paired comparisons are possible? If these comparisons are made by means of Bonferroni paired 7 tests, what o level must be used to attain an overall level of significance that is at most . 10?A quality control engineer conducted an experiment to investigate the effect of experience on an assembly line in terms of the average time required to complete an assembly task. If experience is found to be a factor, a training program is planned for newer employees. The engineer randomly selected eight employees from groups who had completed 1, 2, 3, and 4 years of work experience, respectively. He set up the experiment as a randomized block design with tasks as blocks and years of experience as treatments. The resulting data are given below. Time to complete assembly tasks Experience Task 1 year 1 years 3 years 4 years 40,3 34.2 28.8 26.6 25.4 25.4 29.2 21.2 28.2 28.0 24.6 23.2 41.6 249 29.1 27.0 23.8 39.2 34.8 27.1 38.7 29 26.6 27.3 29.4 29.0 36.0 34.2 37.7 25.6 25.6 25.2 Do the data suggest that a training program might be productive?A computer scientist is studying four different algorithms used to perform numerical integration. The speed (in seconds) with which a problem can be solved is measured. Each algorithm is to be used to solve each of 10 different problems, and hence a problem serves as a block. Algorithm Problem II III IV 10 .11 .16 .10 .11 .13 .17 .09 13 .14 .17 . 12 08 .11 .13 .09 .16 .19 .16 BOX JOHAWN- . 18 23 .16 .07 .11 .07 . 15 .18 14 12 .14 .15 . 12 10 .16 .15 .20 15 Test for differences among the mean times required to solve integration problems for these algorithms.A computer scientist is studying four different algorithms used to perform numerical integration. The speed (in seconds) with which a problem can be solved is measured. Each algorithm is to be used to solve each of 10 different problems, and hence a problem serves as a block. Algorithm Problem II III IV 10 .11 .16 .10 11 .13 .17 .09 13 .14 .17 . 12 08 .11 .13 .09 15 .16 .19 .16 . 18 23 .16 05 .07 .11 07 .13 .15 .18 .14 .12 .14 .15 .12 .16 .15 .20 .15 If the Bonferroni technique is used to compare all pairs of means, how many comparisons are possible? If each is done at the o =.01 level, what is an upper bound for o', the overall probability of committing at least one Type I error
Step by Step Solution
There are 3 Steps involved in it

Get step-by-step solutions from verified subject matter experts