

Question: StatKey Randomization Test for a Difference in Proportions Custom Data Edit Data Randomization method Reallocation Generate 1 Sample Generate 10 Samples Generate 100 Samples Generate
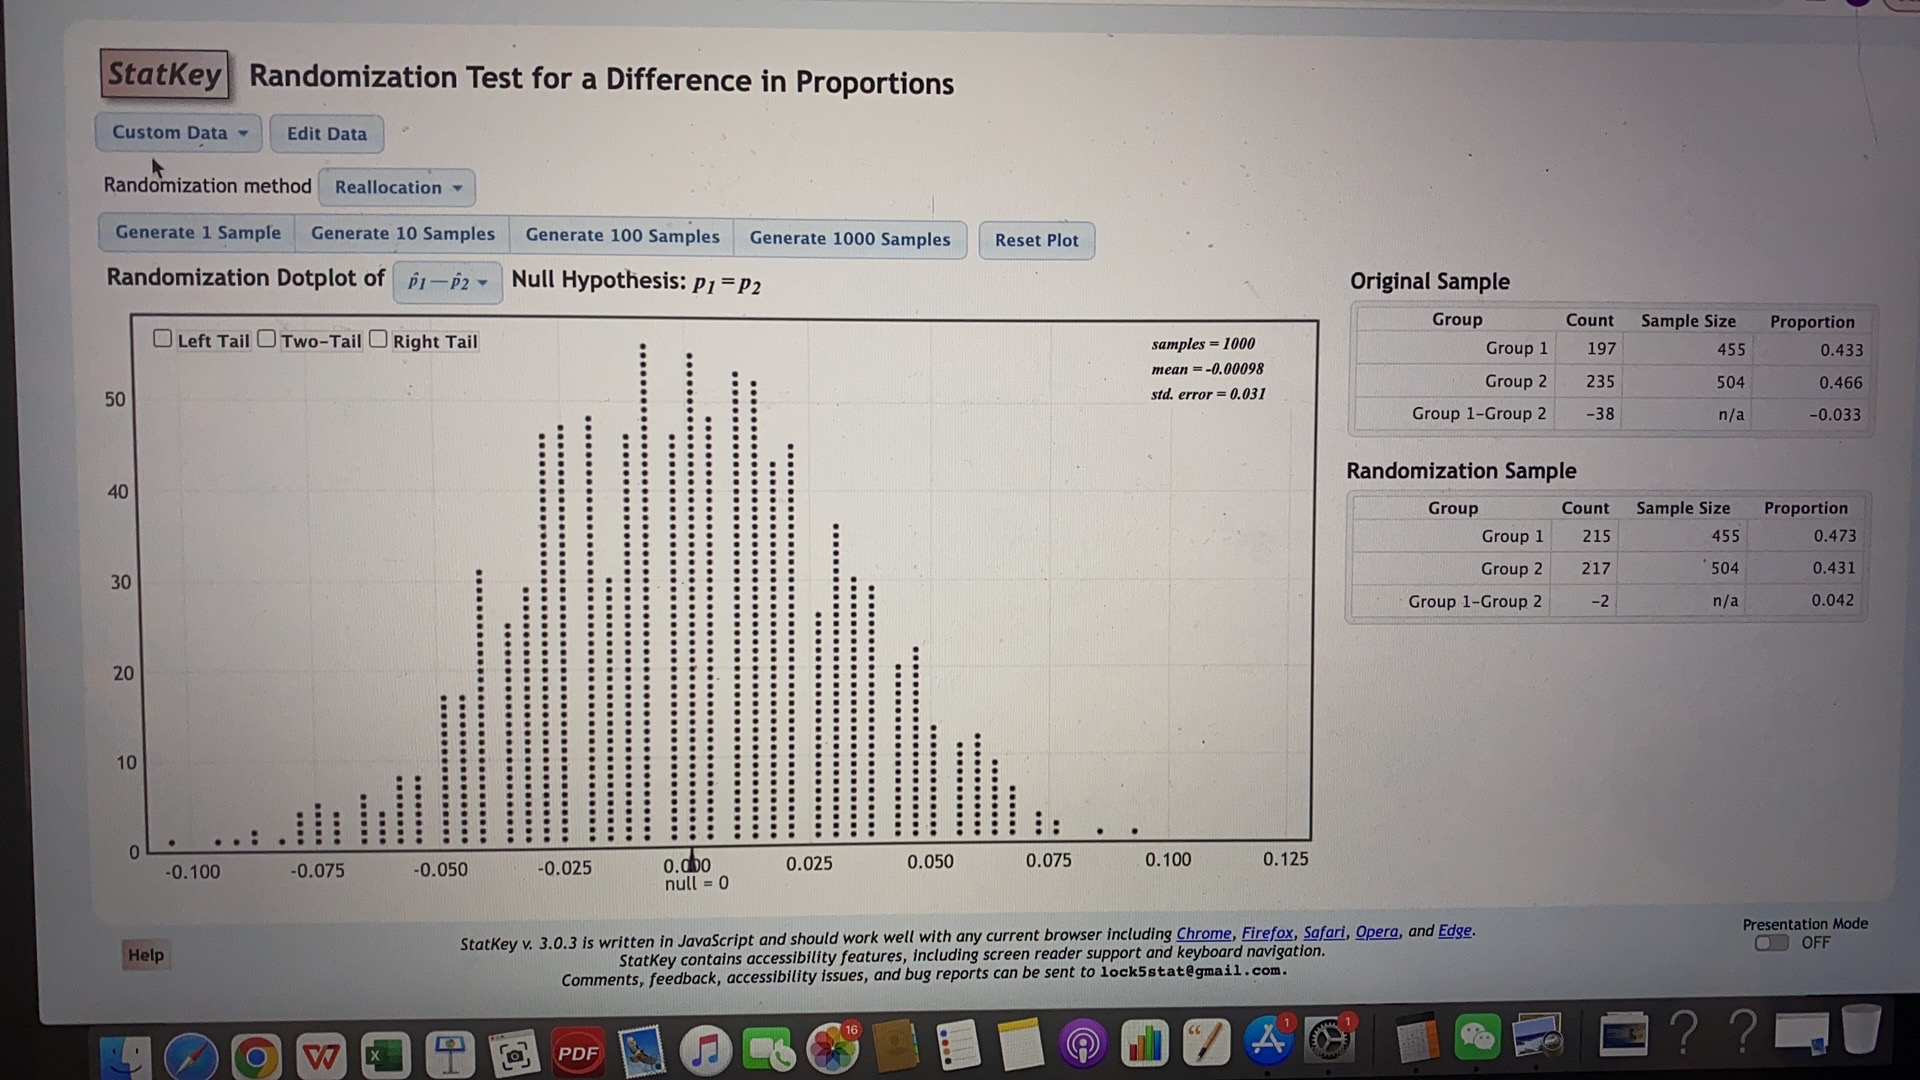
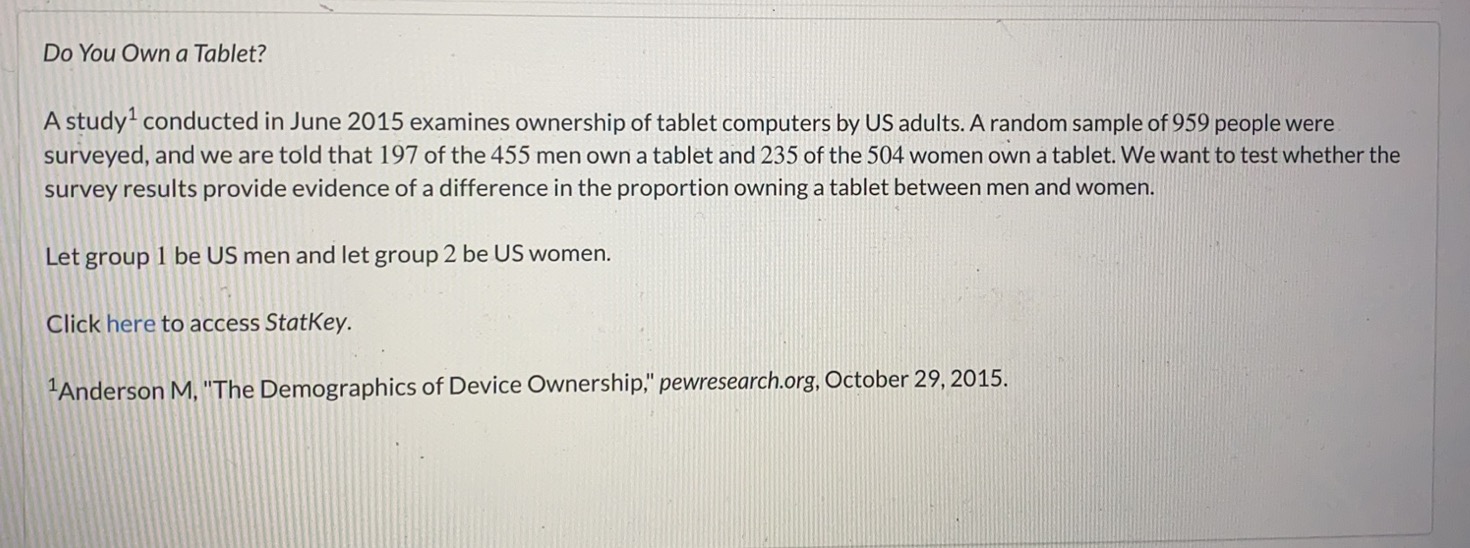


StatKey Randomization Test for a Difference in Proportions Custom Data Edit Data Randomization method Reallocation Generate 1 Sample Generate 10 Samples Generate 100 Samples Generate 1000 Samples Reset Plot Randomization Dotplot of p1-p2 - Null Hypothesis: P1 = P2 Original Sample Group Count Sample Size Proportion O Left Tail OTwo-Tail O Right Tail samples = 1000 Group 1 197 455 0.433 mean = -0.00098 . .. Group 2 235 504 0.466 50 std. error = 0.031 .............. ............... Group 1-Group 2 -38 n/a -0.033 ..... ... Randomization Sample 40 Group Count Sample Size Proportion ............................. Group 1 215 455 0.473 ............................ ............................. Group 2 217 504 0.431 30 ................................. ................... Group 1-Group 2 - 2 n/a 0.042 ....... .......... ................ 20 .................. .......................... ............................... ..................... ................... ................... 10 ........... ......... ............ ......... ...... ....... ........ .... .. .. .... 0.050 -0.025 o.doo 0.025 0.050 0.075 0. 100 0. 125 0. 100 0.075 null = 0 Presentation Mode StatKey v. 3.0.3 is written in JavaScript and should work well with any current browser including Chrome, Firefox, Safari, Opera, and Edge. Help OO OFF StatKey contains accessibility features, including screen reader support and keyboard navigation. Comments, feedback, accessibility issues, and bug reports can be sent to lock5stat@gmail. com. 16 LOW X PDF 0? ?Do You Own a Tablet? A study conducted in June 2015 examines ownership of tablet computers by US adults. A random sample of 959 people were surveyed, and we are told that 197 of the 455 men own a tablet and 235 of the 504 women own a tablet. We want to test whether the survey results provide evidence of a difference in the proportion owning a tablet between men and women. Let group 1 be US men and let group 2 be US women. Click here to access StatKey. Anderson M, "The Demographics of Device Ownership," pewresearch.org, October 29, 2015.(e) Use StatKey or other technology to find the p-value. Round your answer to three decimal places. p-value = H
Step by Step Solution
There are 3 Steps involved in it

Get step-by-step solutions from verified subject matter experts