

Question: Stats 119, please provide an explanation for my future notes. Please and thank you. The frequency distribution below represents frequencies of actual low Choose the
Stats 119, please provide an explanation for my future notes. Please and thank you.
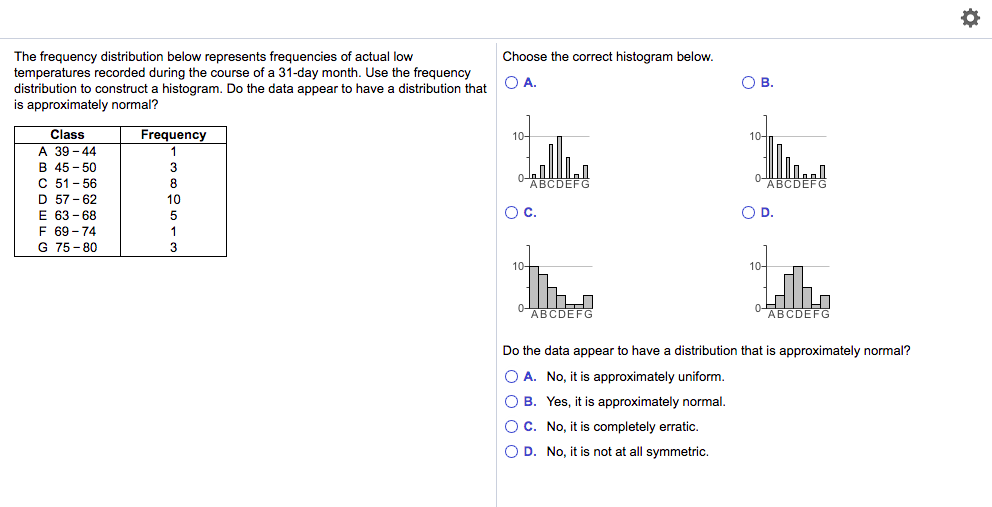
The frequency distribution below represents frequencies of actual low Choose the correct histogram below. temperatures recorded during the course of a 31-day month. Use the frequency distribution to construct a histogram. Do the data appear to have a distribution that O A. O B. is approximately normal? Class Frequency 10- 10- A 39 -44 B 45-50 C 51-56 ABCDEFG ABCDEFG D 57 -62 10 E 63-68 5 O C. OD. F 69-74 G 75 -80 ABCDEFG ABCDEFG Do the data appear to have a distribution that is approximately normal? O A. No, it is approximately uniform. O B. Yes, it is approximately normal. O C. No, it is completely erratic. O D. No, it is not at all symmetric
Step by Step Solution
There are 3 Steps involved in it

Get step-by-step solutions from verified subject matter experts