

Question: stats and prob (a) The standard normal is graphed below. Shade the region under the standard normal curve to the left of z= - 0.50.
stats and prob
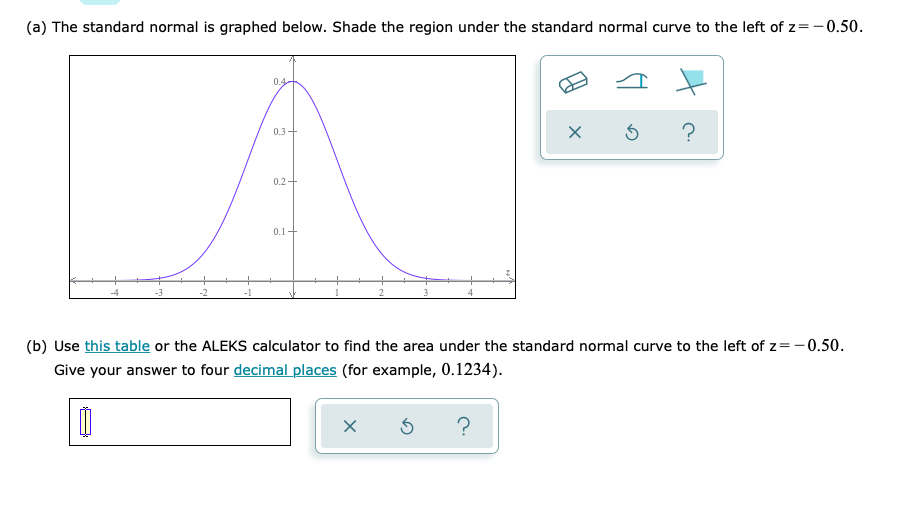
(a) The standard normal is graphed below. Shade the region under the standard normal curve to the left of z= - 0.50. 0.4- 0.3+ X 5 ? 0.2+ 0.1 - (b) Use this table or the ALEKS calculator to find the area under the standard normal curve to the left of z= - 0.50. Give your answer to four decimal places (for example, 0.1234). X 5
Step by Step Solution
There are 3 Steps involved in it
1 Expert Approved Answer
Step: 1 Unlock

Question Has Been Solved by an Expert!
Get step-by-step solutions from verified subject matter experts
Step: 2 Unlock
Step: 3 Unlock