

Question: STATS LAB 4.] Discrete Distribution (Playing Card Experiment) Name: Student Learning Outcomes - The student will compare empirical data and a theoretical distribution to determine
![STATS LAB 4.] Discrete Distribution (Playing Card Experiment) Name: Student Learning](https://s3.amazonaws.com/si.experts.images/answers/2024/06/667a0965125ad_828667a0964dc272.jpg)

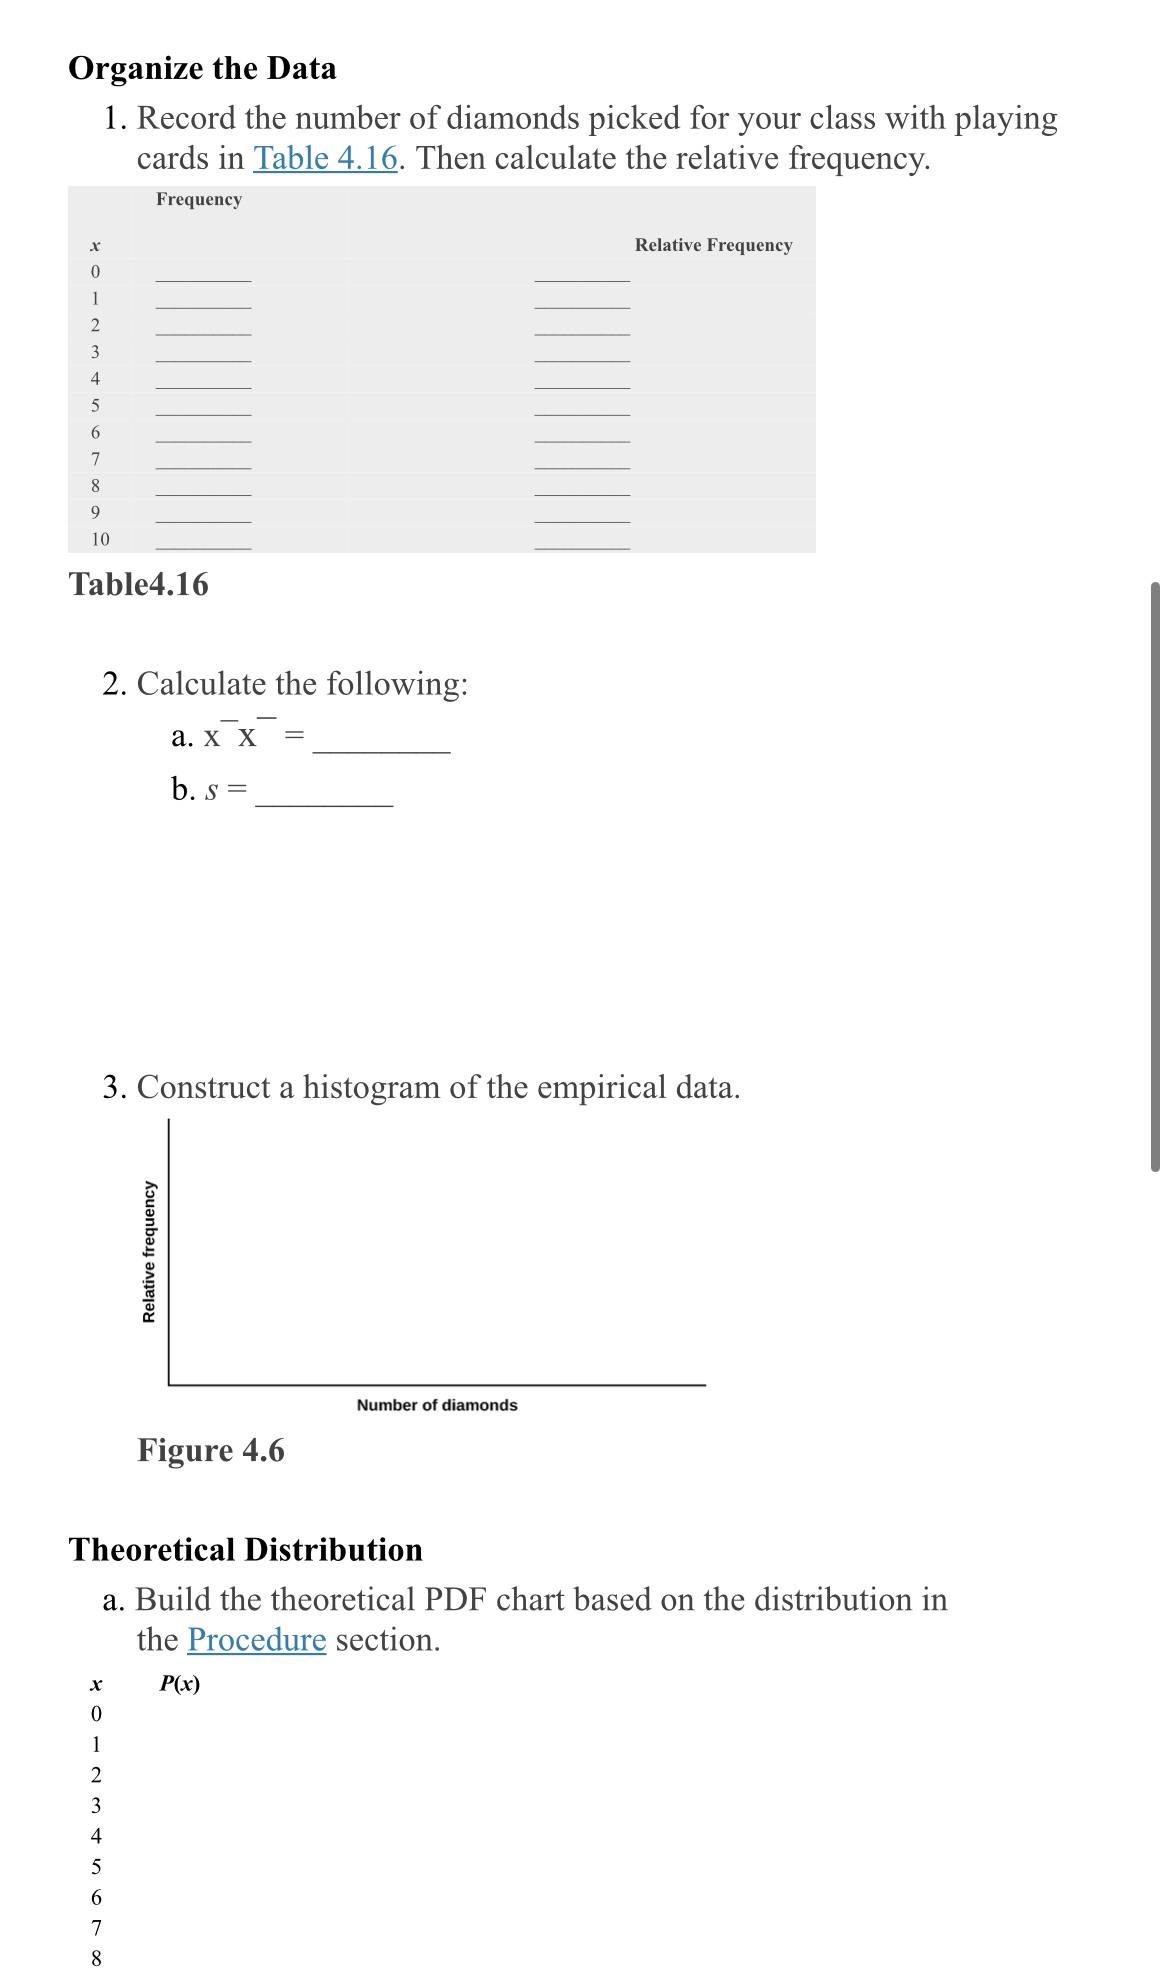
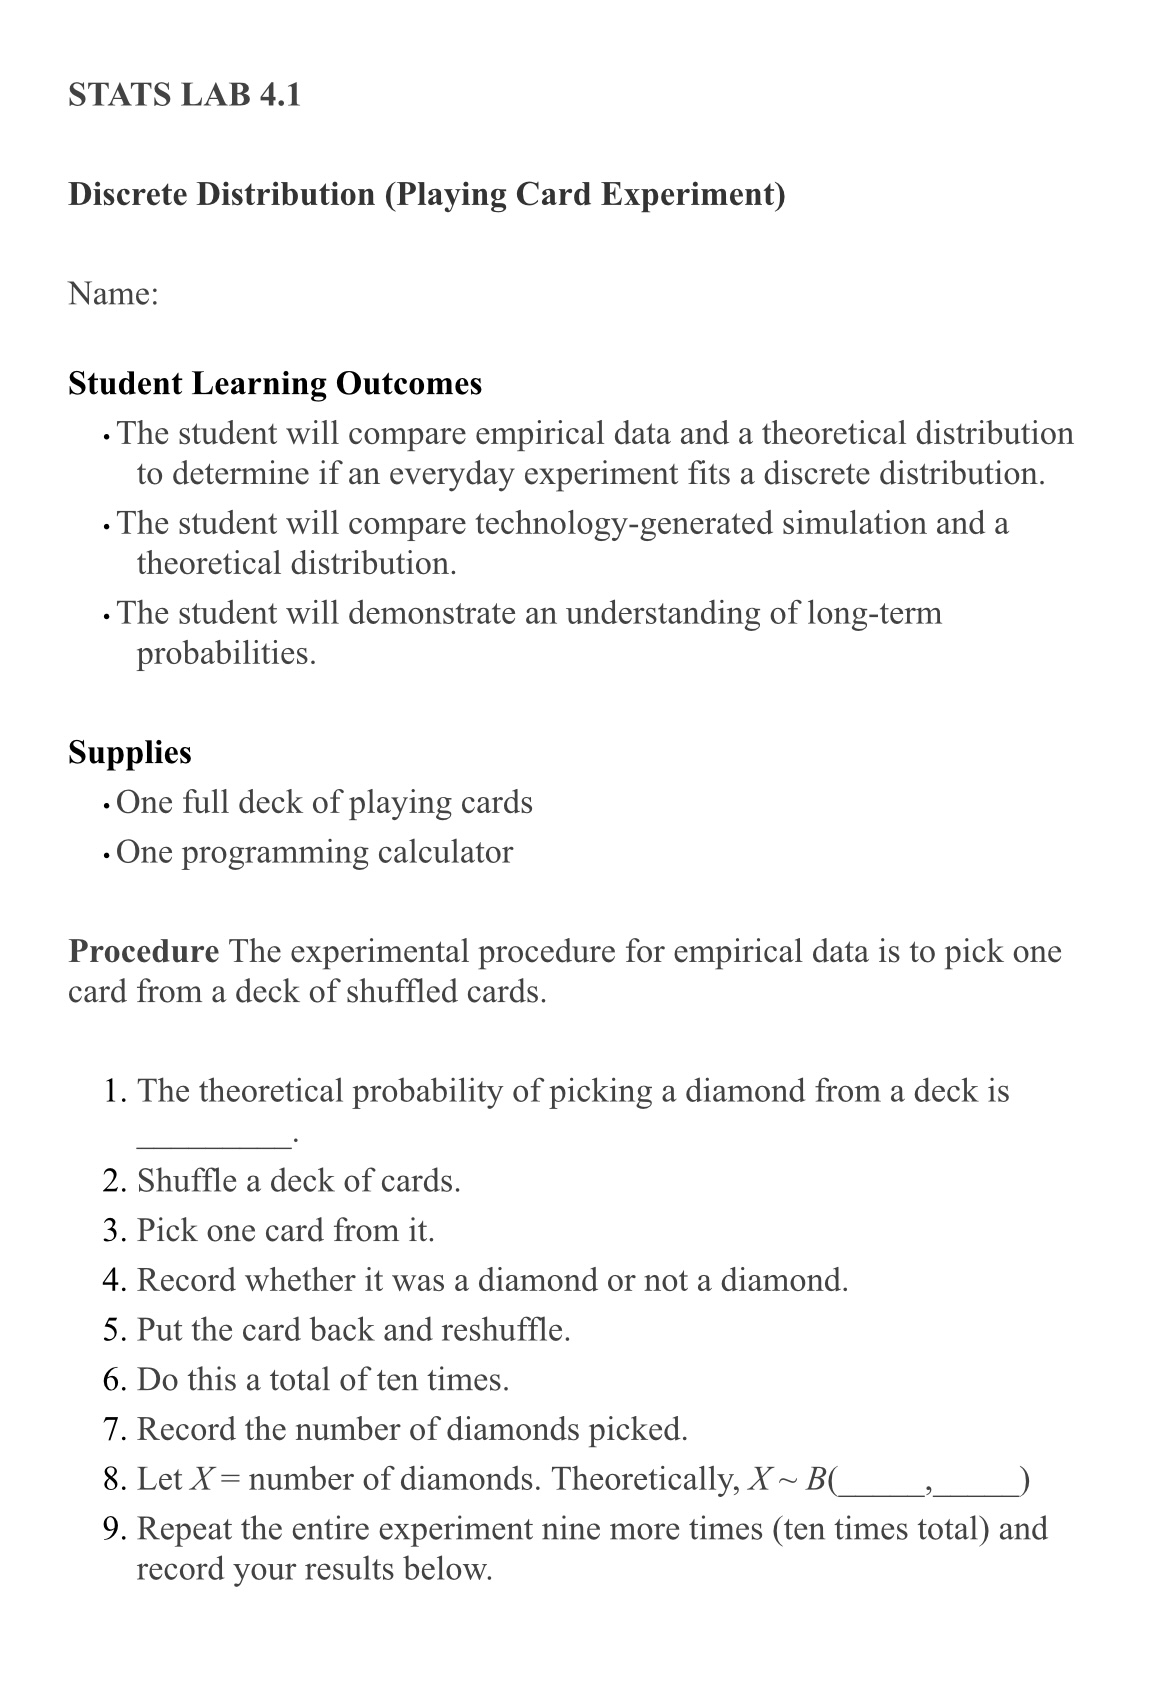

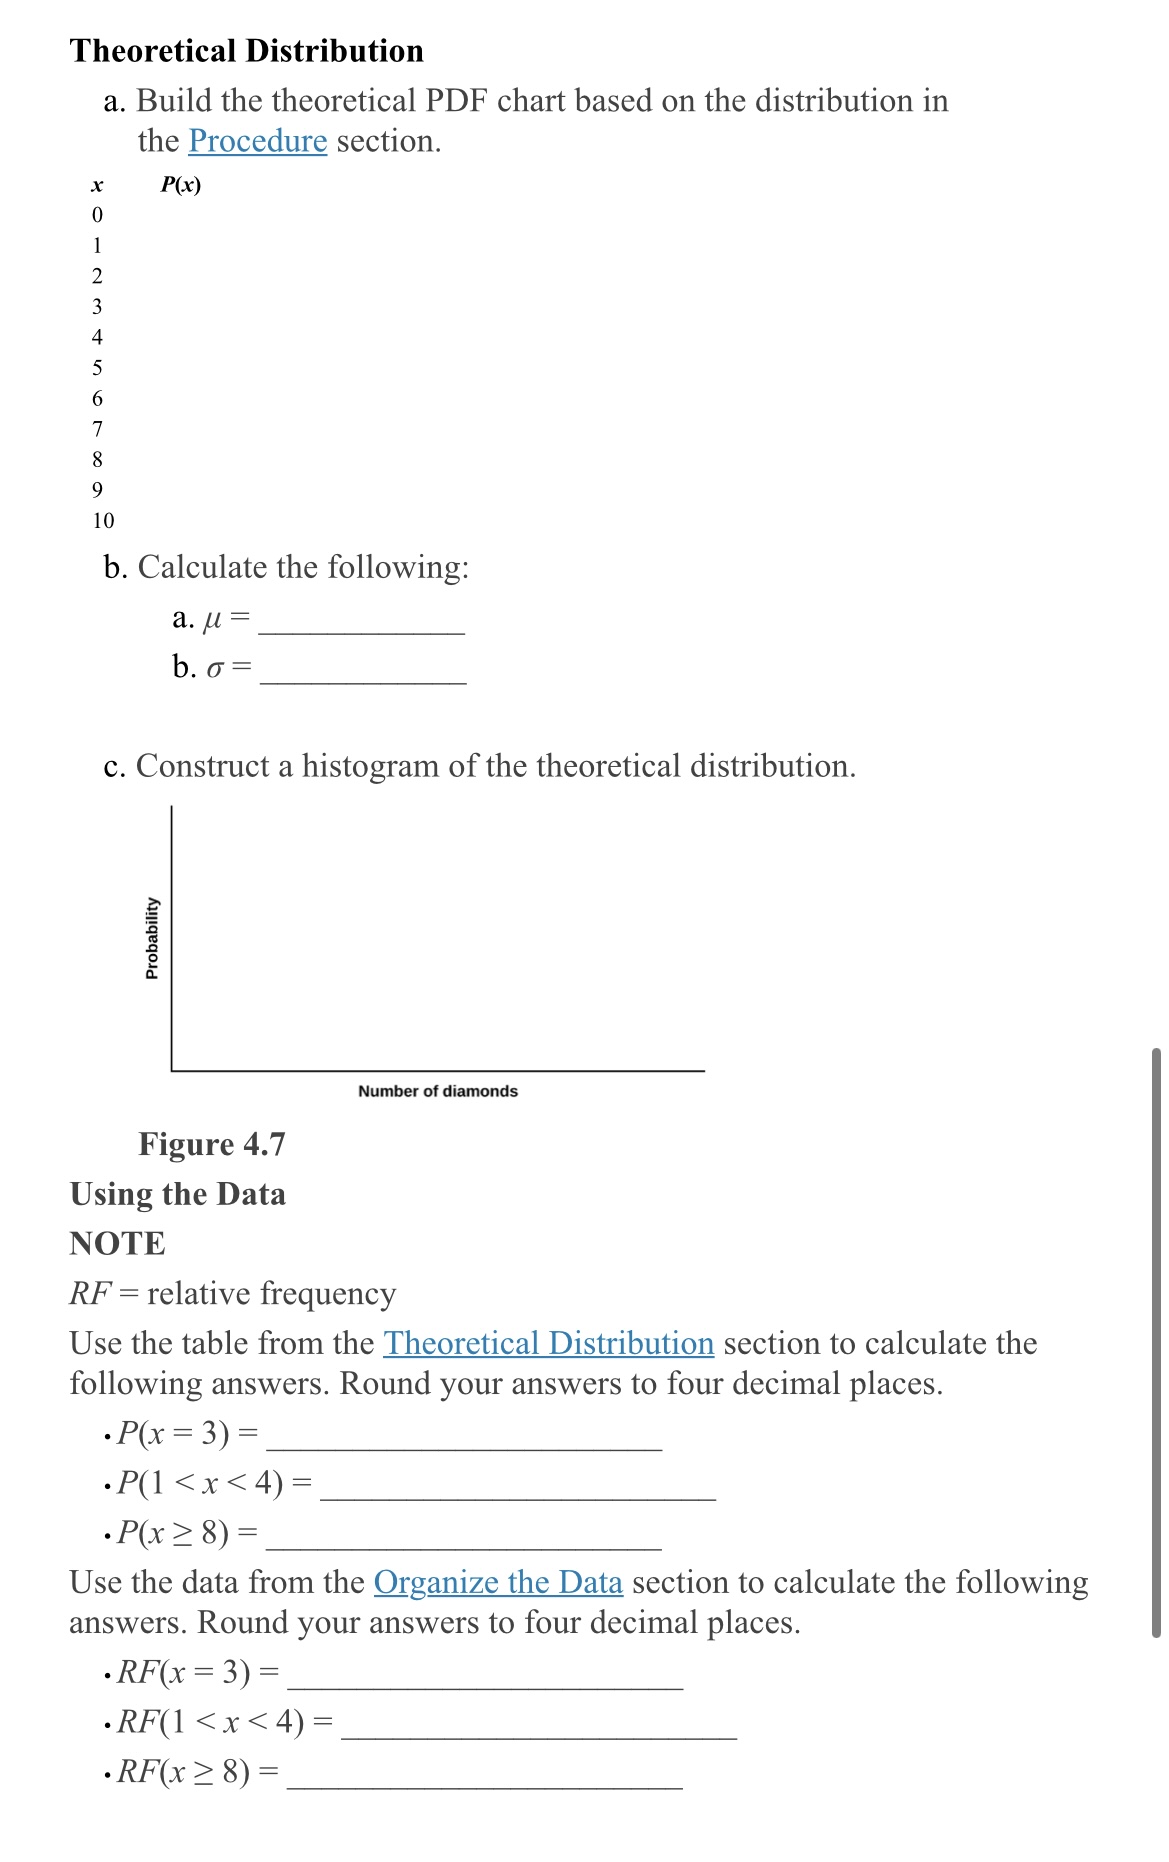

STATS LAB 4.] Discrete Distribution (Playing Card Experiment) Name: Student Learning Outcomes - The student will compare empirical data and a theoretical distribution to determine if an everyday experiment ts a discrete distribution. - The student will compare technologygenerated simulation and a theoretical distribution. - The student will demonstrate an understanding of longterm probabilities. Supplies - One full deck of playing cards - One programming calculator Procedure The experimental procedure for empirical data is to pick one card from a deck of shufed cards. 1. The theoretical probability of picking a diamond from a deck is . Shufe a deck of cards. . Pick one card from it. . Record Whether it was a diamond or not a diamond. . Put the card back and reshufe. . Do this a total of ten times. . Record the number of diamonds picked. . Let X = number of diamonds. Theoretically, X ~ Bl , I . Repeat the entire experiment nine more times (ten times total) and record your results below. \\DOO'JQLJI-P-UJN Discussion QuestionsF or questions 1 and 2, think about the shapes of the two graphs, the probabilities, the relative frequencies, the means, and the standard deviations. 1. Knowing that data vary, describe three similarities between the graphs and distributions of the theoretical, empirical, and simulation distributions. Use complete sentences. 2. Describe the three most signicant differences between the graphs or distributions of the theoretical, empirical, and simulation distributions. 3. Using your answers from questions 1 and 2, does it appear that the two sets of data fit the theoretical distribution? In complete sentences, explain why or why not. 4. Suppose that the experiment had been repeated 5000 times. Would you expect Table 4.16 or F_igure 4.6 to change, and how would it change? Why? Why wouldn't the other table(s) change? Theoretical Distribution a. Build the theoretical PDF chart based on the distribution in the Procedure section. P(x) SOONaUAWN-OK b. Calculate the following: a. u = b. o= c. Construct a histogram of the theoretical distribution. Probability Number of diamonds Figure 4.7 Using the Data NOTE RF = relative frequency Use the table from the Theoretical Distribution section to calculate the following answers. Round your answers to four decimal places. . P(x = 3) = . P(1
Step by Step Solution
There are 3 Steps involved in it

Get step-by-step solutions from verified subject matter experts