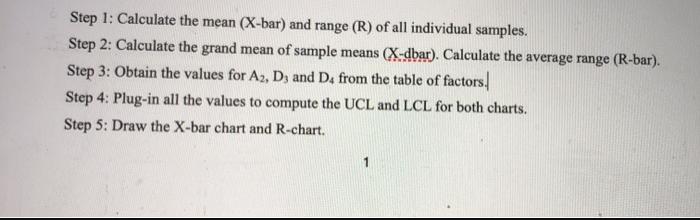
Step 1: Calculate the mean (X-bar) and range (R) of all individual samples. Step 2: Calculate...
Fantastic news! We've Found the answer you've been seeking!
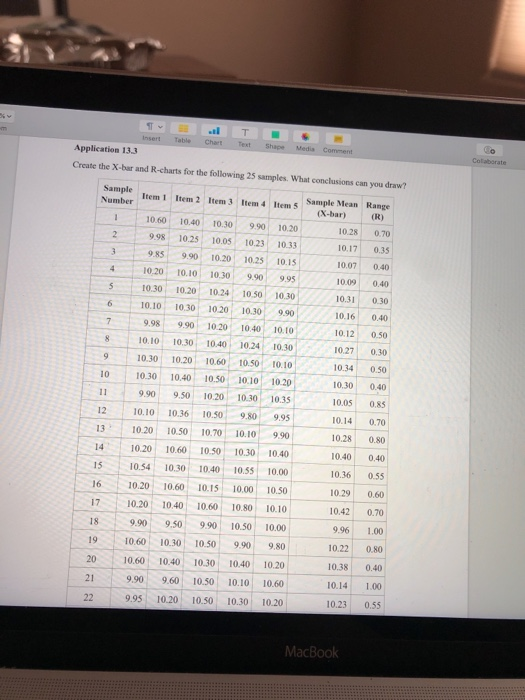
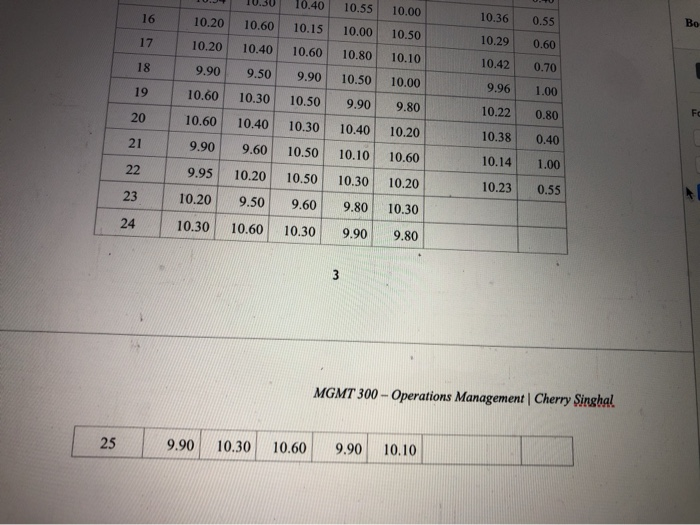
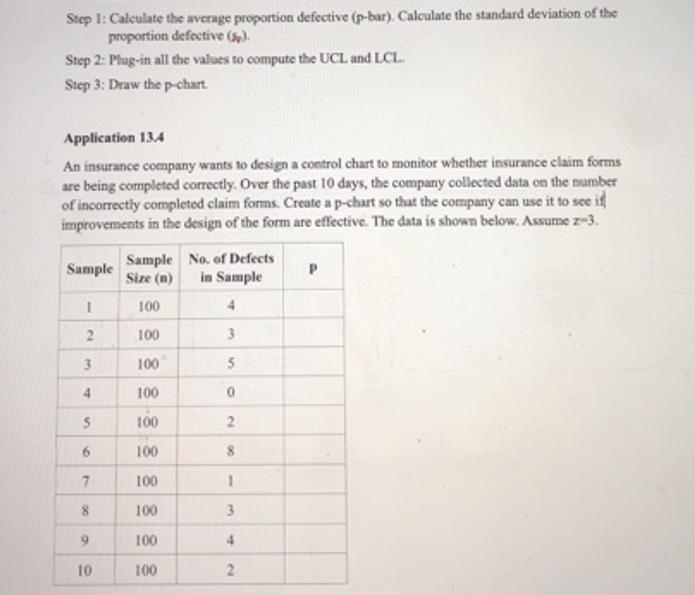
Question:
Transcribed Image Text:
Step 1: Calculate the mean (X-bar) and range (R) of all individual samples. Step 2: Calculate the grand mean of sample means (X-dbar). Calculate the average range (R-bar). Step 3: Obtain the values for A2, D3 and D4 from the table of factors. Step 4: Plug-in all the values to compute the UCL and LCL for both charts. Step 5: Draw the X-bar chart and R-chart. Application 13.3 Create the X-bar and R-charts for the following 25 samples. What conclusions can you draw? 14 15 16 17 2285 18 19 20 Sample Number 1 21 22 2 3 9 10 11 12 13 4 5 6 7 8 Insert Table Chart Text Shape Media Comment Item 1 Item 2 Item 3 Item 4 Item 5 10.60 9.90 10.20 10.40 10.30 9.98 10.25 10.05 10.23 10.33 9.85 9.90 10.20 10.25 10.15 10.20 10.10 10.30 9.90 9.95 10.50 10.30 10.30 9.90 10.40 10.10 10.24 10.30 10.30 10.20 10.24 10.10 10.30 10.20 9.90 10.20 9.98 10.10 10.30 10.40 10.30 10.20 10.60 10.50 10.10 10.30 10.40 10.50 10.10 10.20 9.90 9.50 10.20 10.30 10.35 10.10 10.36 10.50 9.80 9.95 10.20 10.50 10.70 10.10 9.90 10.40 10.20 10.60 10.50 10.30 10.54 10.30 10.40 10.55 10.00 10.20 10.60 10.15 10.00 10.50 10.20 10.40 10.60 10.80 10.10 9.90 9.50 9.90 10.50 10.00 10.60 10.30 10.50 9.90 9.80 10.60 10.40 10.30 10.40 10.20 9.90 9.60 10.50 10.10 10.60 9.95 10.20 10.50 10.30 10.20 Sample Mean Range (X-bar) (R) 10.28 10.17 10.07 10.09 10.31 10.16 10.12 10.27 0.30 10.34 0.50 10.30 0.40 10.05 0.85 10.14 0.70 10.28 0.80 10.40 0.40 10.36 0.55 10.29 10.42 9.96 0.70 0.35 0.40 0.40 0.30 0.40 0.50 MacBook 0.60 0.70 1.00 10.22 0.80 10.38 0.40 10.14 1.00 10.23 0.55 Collaborate 25 16 17 18 19 20 21 7222 23 24 10.40 10.55 10.00 10.20 10.15 10.00 10.50 10.20 10.60 10.80 10.10 9.90 9.50 9.90 10.50 10.00 10.60 10.30 10.50 9.90 9.80 10.60 10.40 10.30 10.40 10.20 9.90 9.60 10.50 10.10 10.60 9.95 10.20 10.50 10.30 10.20 10.20 9.50 9.60 9.80 10.30 10.30 10.60 10.30 9.90 9.80 10.30 10.60 10.40 9.90 10.30 10.60 3 لیا 10.36 10.29 9.90 10.10 10.42 9.96 10.22 10.38 10.14 10.23 0.55 0.60 0.70 1.00 0.80 0.40 1.00 0.55 MGMT 300-Operations Management | Cherry Singhal Bo Fo Step 1: Calculate the average proportion defective (p-bar). Calculate the standard deviation of the proportion defective (Sp). Step 2: Plug-in all the values to compute the UCL and LCL. Step 3: Draw the p-chart. Application 13.4 An insurance company wants to design a control chart to monitor whether insurance claim forms are being completed correctly. Over the past 10 days, the company collected data on the number of incorrectly completed claim forms. Create a p-chart so that the company can use it to see if improvements in the design of the form are effective. The data is shown below. Assume z-3. Sample 1 2 3 4 S 6 7 8 9 10 Sample Size (n) 100 100 100 100 100 100 100 100 100 100 No. of Defects in Sample 4 3 5 0 8 1 3 4 2 P Step 1: Calculate the mean (X-bar) and range (R) of all individual samples. Step 2: Calculate the grand mean of sample means (X-dbar). Calculate the average range (R-bar). Step 3: Obtain the values for A2, D3 and D4 from the table of factors. Step 4: Plug-in all the values to compute the UCL and LCL for both charts. Step 5: Draw the X-bar chart and R-chart. Application 13.3 Create the X-bar and R-charts for the following 25 samples. What conclusions can you draw? 14 15 16 17 2285 18 19 20 Sample Number 1 21 22 2 3 9 10 11 12 13 4 5 6 7 8 Insert Table Chart Text Shape Media Comment Item 1 Item 2 Item 3 Item 4 Item 5 10.60 9.90 10.20 10.40 10.30 9.98 10.25 10.05 10.23 10.33 9.85 9.90 10.20 10.25 10.15 10.20 10.10 10.30 9.90 9.95 10.50 10.30 10.30 9.90 10.40 10.10 10.24 10.30 10.30 10.20 10.24 10.10 10.30 10.20 9.90 10.20 9.98 10.10 10.30 10.40 10.30 10.20 10.60 10.50 10.10 10.30 10.40 10.50 10.10 10.20 9.90 9.50 10.20 10.30 10.35 10.10 10.36 10.50 9.80 9.95 10.20 10.50 10.70 10.10 9.90 10.40 10.20 10.60 10.50 10.30 10.54 10.30 10.40 10.55 10.00 10.20 10.60 10.15 10.00 10.50 10.20 10.40 10.60 10.80 10.10 9.90 9.50 9.90 10.50 10.00 10.60 10.30 10.50 9.90 9.80 10.60 10.40 10.30 10.40 10.20 9.90 9.60 10.50 10.10 10.60 9.95 10.20 10.50 10.30 10.20 Sample Mean Range (X-bar) (R) 10.28 10.17 10.07 10.09 10.31 10.16 10.12 10.27 0.30 10.34 0.50 10.30 0.40 10.05 0.85 10.14 0.70 10.28 0.80 10.40 0.40 10.36 0.55 10.29 10.42 9.96 0.70 0.35 0.40 0.40 0.30 0.40 0.50 MacBook 0.60 0.70 1.00 10.22 0.80 10.38 0.40 10.14 1.00 10.23 0.55 Collaborate 25 16 17 18 19 20 21 7222 23 24 10.40 10.55 10.00 10.20 10.15 10.00 10.50 10.20 10.60 10.80 10.10 9.90 9.50 9.90 10.50 10.00 10.60 10.30 10.50 9.90 9.80 10.60 10.40 10.30 10.40 10.20 9.90 9.60 10.50 10.10 10.60 9.95 10.20 10.50 10.30 10.20 10.20 9.50 9.60 9.80 10.30 10.30 10.60 10.30 9.90 9.80 10.30 10.60 10.40 9.90 10.30 10.60 3 لیا 10.36 10.29 9.90 10.10 10.42 9.96 10.22 10.38 10.14 10.23 0.55 0.60 0.70 1.00 0.80 0.40 1.00 0.55 MGMT 300-Operations Management | Cherry Singhal Bo Fo Step 1: Calculate the average proportion defective (p-bar). Calculate the standard deviation of the proportion defective (Sp). Step 2: Plug-in all the values to compute the UCL and LCL. Step 3: Draw the p-chart. Application 13.4 An insurance company wants to design a control chart to monitor whether insurance claim forms are being completed correctly. Over the past 10 days, the company collected data on the number of incorrectly completed claim forms. Create a p-chart so that the company can use it to see if improvements in the design of the form are effective. The data is shown below. Assume z-3. Sample 1 2 3 4 S 6 7 8 9 10 Sample Size (n) 100 100 100 100 100 100 100 100 100 100 No. of Defects in Sample 4 3 5 0 8 1 3 4 2 P
Expert Answer:
Answer rating: 100% (QA)
To create the Xbar and Rcharts we need to follow the steps outlined Lets process the given information step by step Step 1 Calculate the mean Xbar and ... View the full answer
Related Book For
Posted Date:
Students also viewed these general management questions
-
The p-value is 0.0371. What conclusions can you reach and what error might have been made?
-
What conclusions can you draw about f from the information that f'(c) = f"(c) = 0 and f"'(c) > 0?
-
Mr. Paulie Gualtieri has started a new laundry business called, "Walnut Cleaners. He started the business with the following assets: Building worth $80,000, Bank $35,000, Washing Machines worth...
-
Consider a portfolio of the following derivatives where the counterparty is an OECD bank. Derivative 8-year interest rate swap 6-month option on an equity 1-year swap on precious metals 9-month...
-
Draw a graph of the following points. What can you say about theresults? x 1 3 6 8 9 10 13 14 17 18 21 25 26 29 22 24 31 38 41 44 52 55 61 64 69 76 81 83
-
What is the Leadership Framework that is discussed in the Visionary Director? What roles are represented in the framework? Describe each role in full. What side of the framework feels more familiar...
-
Consider the 2016 major league baseball data in Table B.22. While team ERA was useful in predicting the number of games that a team wins, there are some other measures of team performance, including...
-
For no apparent reason, a poodle is running at a constant speed of v ~ 5.00 m/s in a circle with radius R = 2.50 m. Let VI be the velocity vector at time t" and let V2 be the velocity vector at time...
-
For the current year, Maple Corporations book income before federal income tax was $100,000. Included in this $100,000 were the following: Provision for state income tax $1,000 Interest earned on...
-
The following information is available for ADT Company, which produces special-order security products and uses a job order costing system. Overhead is applied using a predetermined overhead rate of...
-
It has been my experience that a portfolio manager can perform poorly on the returns front but as long as they "beat" their benchmark they have done well. In today's environment, we see a lot of...
-
Required Complete the following worksheet for the year ended 30 June 2020 using the unadjusted trial balance in the worksheet and the additional information provided below. (14 marks) a. A stocktake...
-
Question 10 Write R code to generate a random sample of size 20 from a normal distribution with mean of 100 and standard deviation of 4. Next, generate a variable y = 2 + x + , where represents noise...
-
Simulate two Normally distributed random variables X1 and X2 with correlation 0.8, both should have a mean value of 70 and a standard deviation of 8. equation 5.3.2 for formulas that will help you...
-
(2) Example (d) in section 16.8 of the book shows the derivation of the flux density of a thin homogenously charged ring (radius R, charge Q) in the symmetry axis of the ring at distance x Q X 4...
-
4. Consider two magnetic dipoles: m = m, at the origin and m2 = m, at 7 = re. (a) Sketch or plot the magnetic field of my in the az-plane. (b) By thinking of me as a small loop of current, argue...
-
Some ideal gas is confined in a container, given that the pressure is 20000 Pa, the volume is 5 m, and the temperature is 300 K. A) Find the number of mole of the ideal gas. B) Find the total kinetic...
-
Describe a group you belong or have belonged discuss the stages of group development and suggest how to improve the group effectiveness by using the group development model.
-
Suppose a study were to find that twice as many users of nicotine patches quit smoking than non-users. Suppose you are a smoker trying to quit. Which version of an answer to each of the following...
-
Refer to Exercise 36, about a report on the relationship between drinking alcohol and likelihood of death, with the headline Study: Daily drink cuts death. a. Explain whether you think the headline...
-
a. News Story 2: Research shows women harder hit by hangovers. b. News Story 15: Kids stress, snacking linked. c. News Story 20: Eating Organic Foods Reduces Pesticide Concentrations in Children.
-
Given the four criteria necessary for a sale to be complete, which of the following is not one of those conditions? 1. Delivery has occurred or services rendered. 2. Cash has been collected. 3. The...
-
What is the difference between a business and a pure charity? Between a business and a governmental agency?
-
Sketch the \(P-V\) phase diagram for helium-4 using the sketch of the \(P-T\) phase diagram in Figure 4.3. Ps P S superfluid Pe T To T FIGURE 4.3 Sketch of the P-T phase diagram for helium-4. The...
Study smarter with the SolutionInn App