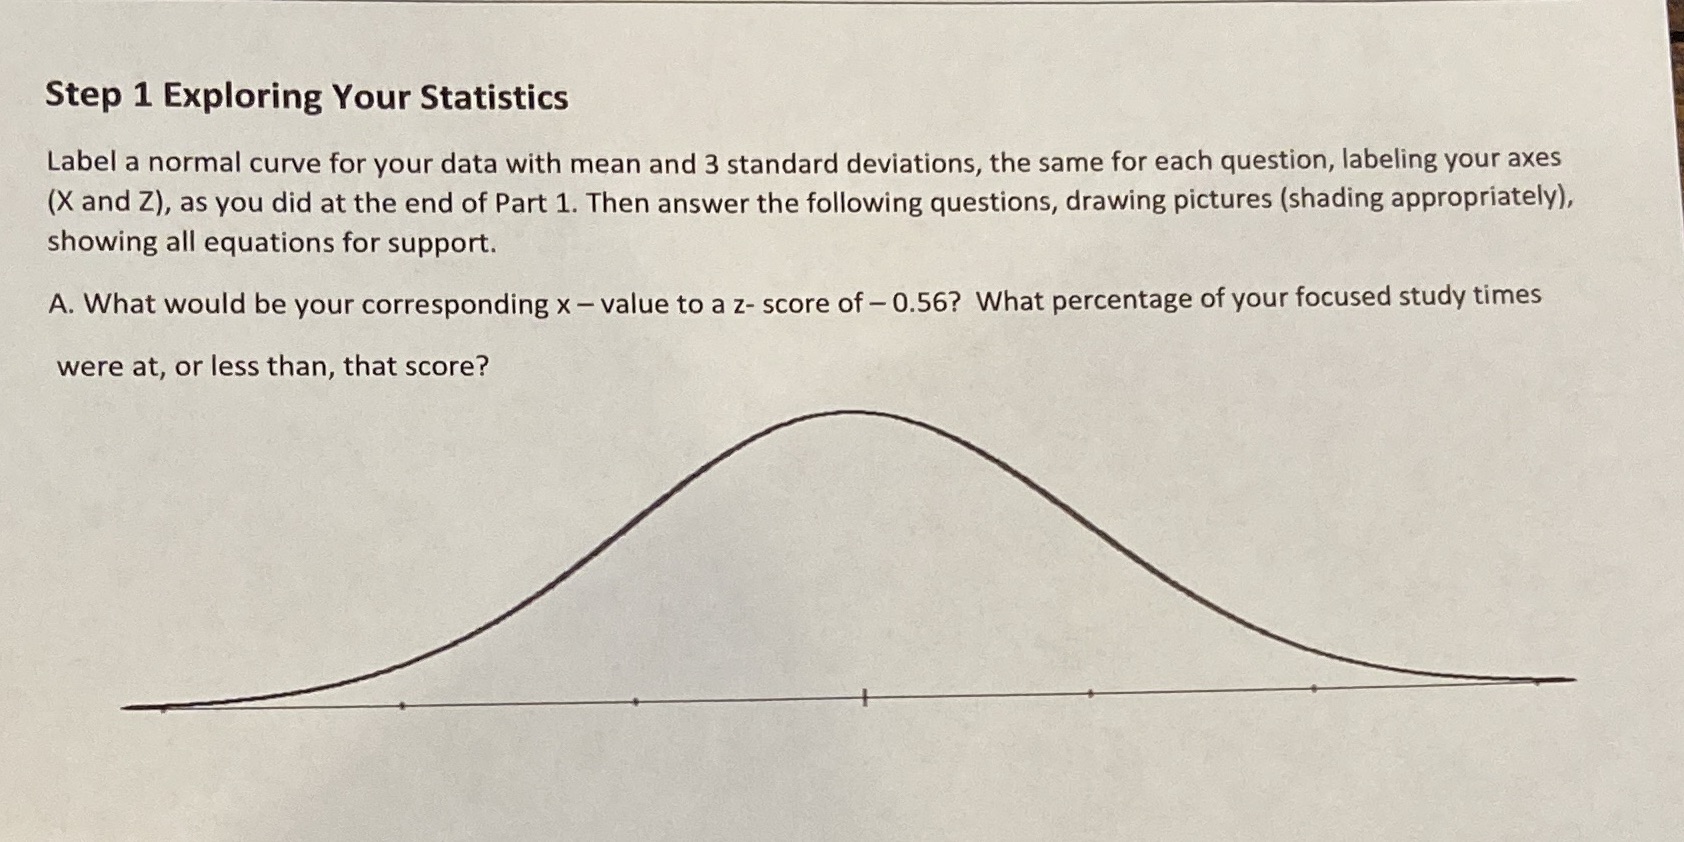
Question: Step 1 Exploring Your Statistics Label a normal curve for your data with mean and 3 standard deviations, the same for each question, labeling your

Step 1 Exploring Your Statistics Label a normal
Step 1 Exploring Your Statistics Label a normal curve for your data with mean and 3 standard deviations, the same for each question, labeling your axes (X and Z), as you did at the end of Part 1. Then answer the following questions, drawing pictures (shading appropriately), showing all equations for support. A. What would be your corresponding x - value to a z- score of - 0.56? What percentage of your focused study times were at, or less than, that score

Step by Step Solution

There are 3 Steps involved in it

1 Expert Approved Answer
Step: 1 Unlock blur-text-image
Question Has Been Solved by an Expert!

Get step-by-step solutions from verified subject matter experts

Step: 2 Unlock
Step: 3 Unlock

Students Have Also Explored These Related Mathematics Questions!