

Question: Step 1: For the assignment, you need to choose a product with complementary, substitute products, income and taste. In the Coursera example: The main product:
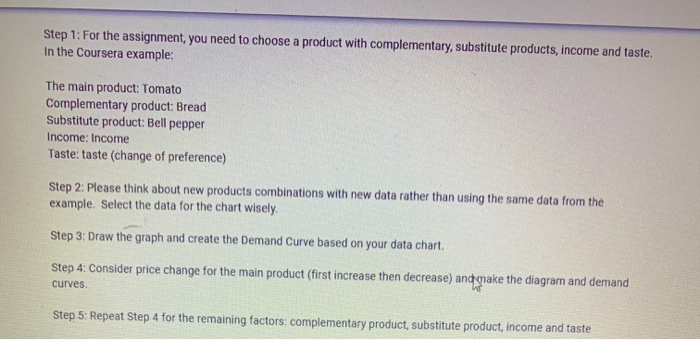
Step 1: For the assignment, you need to choose a product with complementary, substitute products, income and taste. In the Coursera example: The main product: Tomato Complementary product: Bread Substitute product: Bell pepper Income: Income Taste: taste (change of preference) Step 2: Please think about new products combinations with new data rather than using the same data from the example. Select the data for the chart wisely Step 3: Draw the graph and create the Demand Curve based on your data chart. Step 4: Consider price change for the main product (first increase then decrease) and make the diagram and demand curves Step 5: Repeat Step 4 for the remaining factors: complementary product, substitute product, income and taste Step 1: For the assignment, you need to choose a product with complementary, substitute products, income and taste. In the Coursera example: The main product: Tomato Complementary product: Bread Substitute product: Bell pepper Income: Income Taste: taste (change of preference) Step 2: Please think about new products combinations with new data rather than using the same data from the example. Select the data for the chart wisely Step 3: Draw the graph and create the Demand Curve based on your data chart. Step 4: Consider price change for the main product (first increase then decrease) and make the diagram and demand curves Step 5: Repeat Step 4 for the remaining factors: complementary product, substitute product, income and taste
Step by Step Solution
There are 3 Steps involved in it

Get step-by-step solutions from verified subject matter experts