

Question: Step 1 : Ms. Beurre is the CEO of Better Butter, a company that specializes in making butter.She recently read an article discussing some recent
Step 1: Ms. Beurre is the CEO of Better Butter, a company that specializes in making butter.She recently read an article discussing some recent data that showed countries with higher butter consumption also have higher self-reported life satisfaction. She thinks this research could inform a new advertising campaign for Better Butter's latest product, but she wants to make sure she's understanding the study first.
1) Focus on the graph below. What does one dot represent on this scatterplot?
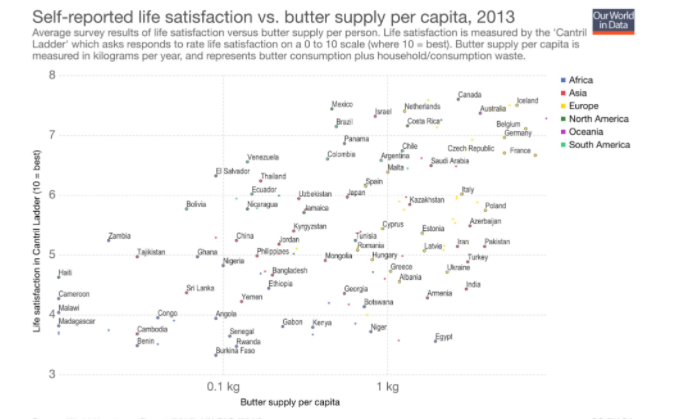
Self-reported life satisfaction vs. butter supply per capita, 2013 Our World in Data Average survey results of life satisfaction versus butter supply per person. Life satisfaction is measured by the 'Cantril Ladder' which asks responds to rate life satisfaction on a 0 to 10 scale (where 10 = best). Butter supply per capita is measured in kilograms per year, and represents butter consumption plus household/consumption waste. B Africa Canada Asia Mexico Jarany Netherlands Australia . Europe Brazil Posta Rier Belgium North America 7 Panama Germany Oceania Chile Czech Republic , Frames. South America Venanela Colombia Malty = Thailand Spain 6 Ecuador Japan day Bolivia "Kazakhstan Poland Cyprus Azerbaijan Estonia Zambia Jordan Tunisia Life satisfaction in Cantril Ladder (10 = best) Jan Pakistan 5 Tajikistan Ghana Philippbes .* Mangola Hungary . Turkey Haiti .. Bangladesh Greece Albania Cameroon Sri Lanka Ethiopia Goongia India Yemen Armenia Malared Botswana Cango Angola Andagascar Gabon Karya Cambodia Senegal Niger Benin . Rwanda Farpl Burkina Faso 3 0.1 kg 1 kg Butter supply per capita
Step by Step Solution
There are 3 Steps involved in it

Get step-by-step solutions from verified subject matter experts