

Question: Step 1 : Understand the data The first step of exploratory data analysis is to explore the number of instances, number of features, and type
Step : Understand the data
The first step of exploratory data analysis is to explore the number of instances, number of features, and type of each feature. A data frame contains feature names and descriptions for all features in a dataset. Data frames are presented as tables or bulleted lists and are important resources for understanding a dataset.
A points Read the HWDataset into pandas DataFrame dfmain, and create two other data frames by selecting data from the dfmain, one has only data of categorical features, and the second contains data of numerical features call them dfcat, and dfnum, respectively.
a How many instances are in the HWDataset?
b How many features are in the HWDataset in total?
c Which columns are categorical in the dataset?
Step : Identify relationships between features
Once the dataset's size and features are understood, the relationships between features should be explored. Data visualizations like scatter plots give a visual representation of how pairs of features change together. Scatter plots and other visualizations may suggest possible models for making predictions or describing relationships. Ex: If two features have a strong linear relationship, then a model based on a straight line might be a good fit.
A pointsa Let us suppose that our target variable is the price, an important step towards understanding the data features is to identify their relationship with the target variable. Depict a pair plot that shall help show the relation of features against the target variable and differentiate that with the brandname. b Determine and print the strength and direction of the relationship of each numerical feature against the price column.
A points Studying the memory RAM may reveal more information. Our project sponsor is keen to find answers to the following questions:
a Which brand produces phones with all possible RAM sizes?
b Which brands produce phones with GB of RAM?
c Which brands produce phones with GB and MB of RAM?
A points EDA involves understanding the distribution of the data as well as determining if we have to deal with outliers. Based on the prices, we may find brands with outliers.
a Use a box plot to visualize the price column differentiated with brands
b How many Redmi phones would be considered outliers based on the price column? Select and print the instances that are Redmi and outliers.
A pointsGiven the mobile dataset, we noticed several numerical and categorical features. Using Principal Component Analysis PCA we can reduce the dimensionality of the dataset and yet retrain a reasonable amount of information. We assume price column is our target variable, using Python code to perform PCA and answer the following:
a How many principal components total that we can get by applying the PCA on the mobile dataset that assuming price is a target variable? hint: dont convert categorical columns into numerical
b How much variations were captured by the first two components, round your results into decimal places?
c Using PCA which of the numerical features contribute the most to the first principal component? Sort the features based on their contribution to the first principal component.
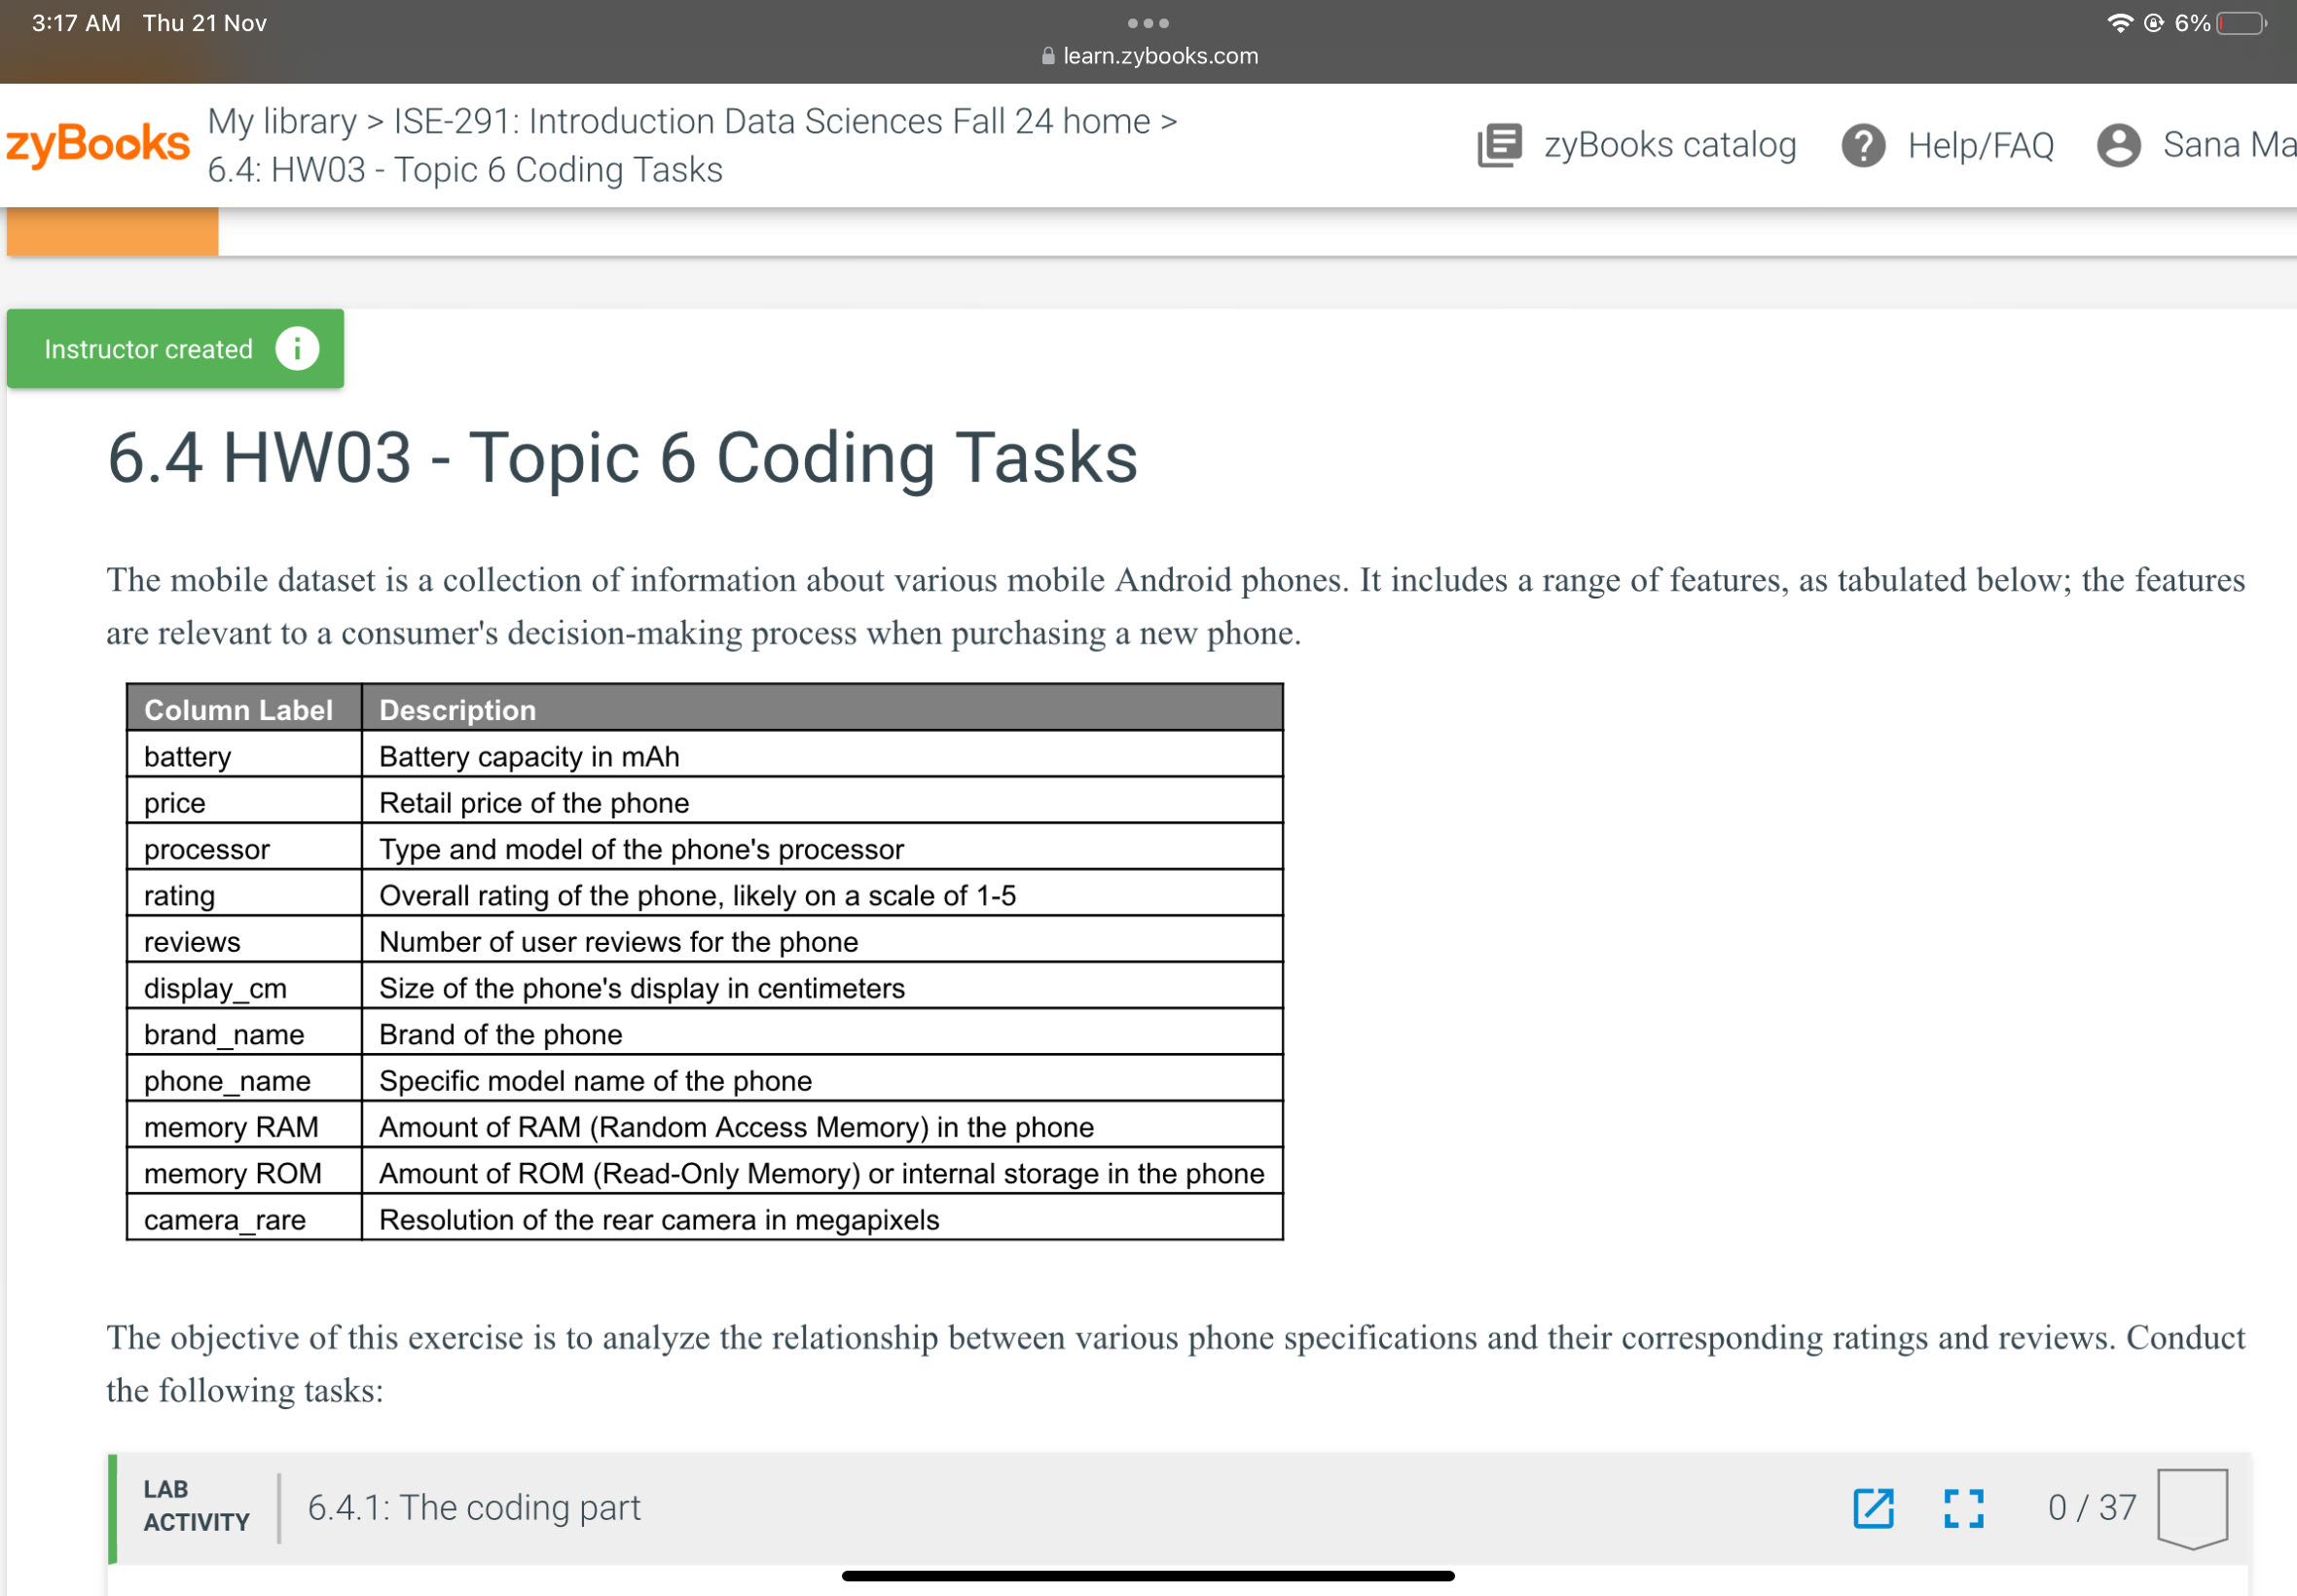
HW Topic Coding Tasks
The mobile dataset is a collection of information about various mobile Android phones. It includes a range of features, as tabulated below; the features are relevant to a consumer's decisionmaking process when purchasing a new phone.
The objective of this exercise is to analyze the relationship between various phone specifications and their corresponding ratings and reviews. Conduct the following tasks:
LAB
Step by Step Solution
There are 3 Steps involved in it
1 Expert Approved Answer
Step: 1 Unlock

Question Has Been Solved by an Expert!
Get step-by-step solutions from verified subject matter experts
Step: 2 Unlock
Step: 3 Unlock