

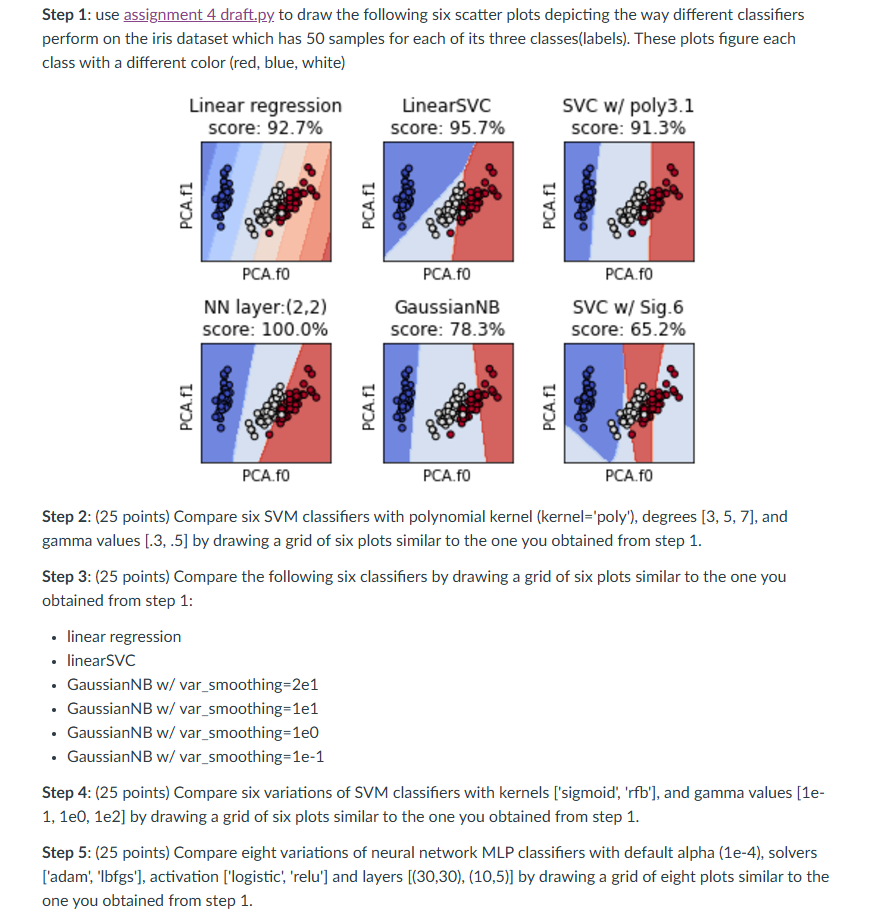
Question: Step 1 : use assignment 4 draft.py to draw the following six scatter plots depicting the way different classifiers perform on the iris dataset which
Step : use assignment draft.py to draw the following six scatter plots depicting the way different classifiers
perform on the iris dataset which has samples for each of its three classeslabels These plots figure each
class with a different color red blue, white
PCA.f
PCA.f
PCA.f
SVC w Sig.
score:
PCA.f
PCA.f
Step : points Compare six SVM classifiers with polynomial kernel kernel'poly' degrees and
gamma values by drawing a grid of six plots similar to the one you obtained from step
Step : points Compare the following six classifiers by drawing a grid of six plots similar to the one you
obtained from step :
linear regression
linearSVC
GaussianNB w varsmoothinge
GaussianNB w varsmoothinge
GaussianNB w varsmoothinge
GaussianNB w varsmoothinge
Step : points Compare six variations of SVM classifiers with kernels sigmoidrfb and gamma values e
ee by drawing a grid of six plots similar to the one you obtained from step
Step : points Compare eight variations of neural network MLP classifiers with default alpha e solvers
adam 'Ibfgs' activation logistic 'relu' and layers by drawing a grid of eight plots similar to the
one you obtained from step
assignment draft.py
from sklearn.decomposition import PCA import matplotlib.pyplot as plt from sklearn import svm datasets from sklearn.naivebayes import GaussianNB from sklearn.inspection import DecisionBoundaryDisplay from sklearn.modelselection import traintestsplit from sklearn.neuralnetwork import MLPClassifier from sklearn.linearmodel import LinearRegression pca PCA #Step : loading the dataset iris datasets.loadiris #Step : transforming the dataset features to reduce dimensions from D to D Xtransformed pca.fittransformirisdata #Step : obtaining the true labels of dataset y iris.target #Step : splitting the dataset into testing set and training set in a random fashion Xtrain, Xtest, ytrain, ytest traintestsplitXtransformed, y testsize randomstate #Step : Defining models and fitting them to our training set models LinearRegression svmLinearSVCC maxiter svmSVCkernel'poly', degree gamma C MLPClassifiersolverlbfgs alpha hiddenlayersizesactivation'logistic', randomstate GaussianNBvarsmoothinge svmSVCkernel"sigmoid", gamma C models clffitXtrain, ytrain for clf in models # Step : Drawing the plots titles Linear regression", "LinearSVC", SVC w polyNN layer: "GaussianNB", SVC w Sig fig, sub pltsubplots pltsubplotsadjustwspace hspace X X Xtrain: Xtrain: for clf title, ax in zipmodels titles, sub.flatten: disp DecisionBoundaryDisplay.fromestimator clf Xtrain, responsemethod"predict", cmappltcmcoolwarm, alpha axax xlabel'PCA.f ylabel'PCA.f axscatterX X cytrain, cmappltcmcoolwarm, s edgecolorsk axsetxticks axsetyticks axsettitletitle
score: strroundclfscoreXtest,ytest# pltshow
Step by Step Solution
There are 3 Steps involved in it
1 Expert Approved Answer
Step: 1 Unlock

Question Has Been Solved by an Expert!
Get step-by-step solutions from verified subject matter experts
Step: 2 Unlock
Step: 3 Unlock