

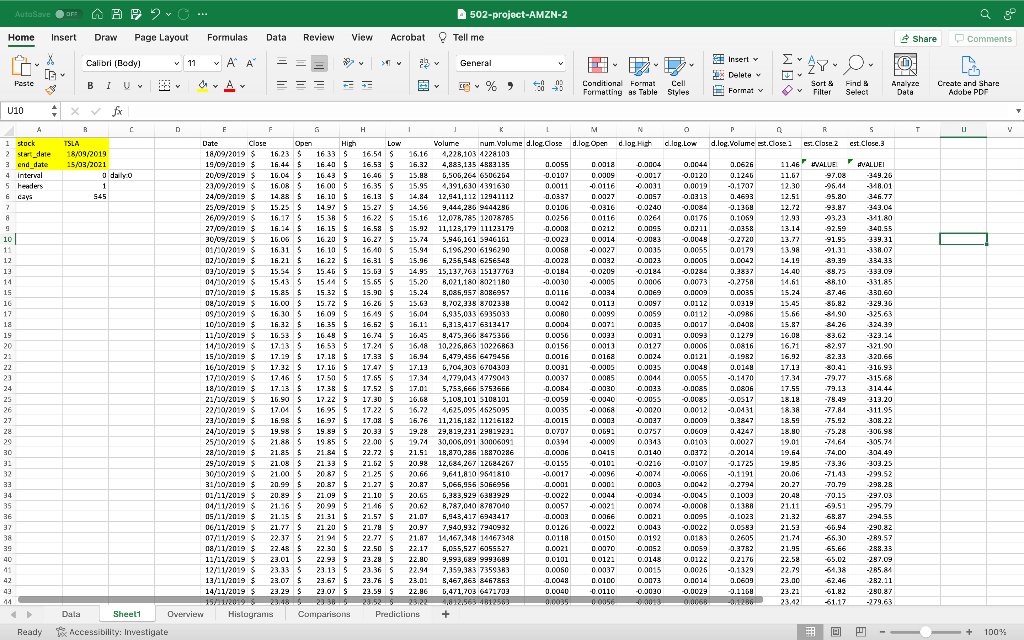
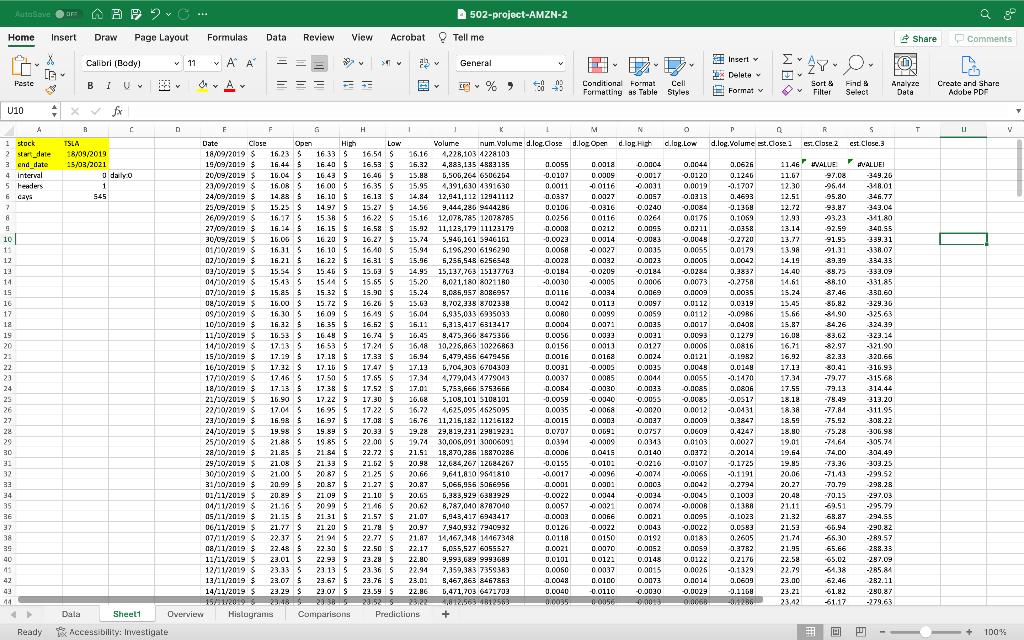
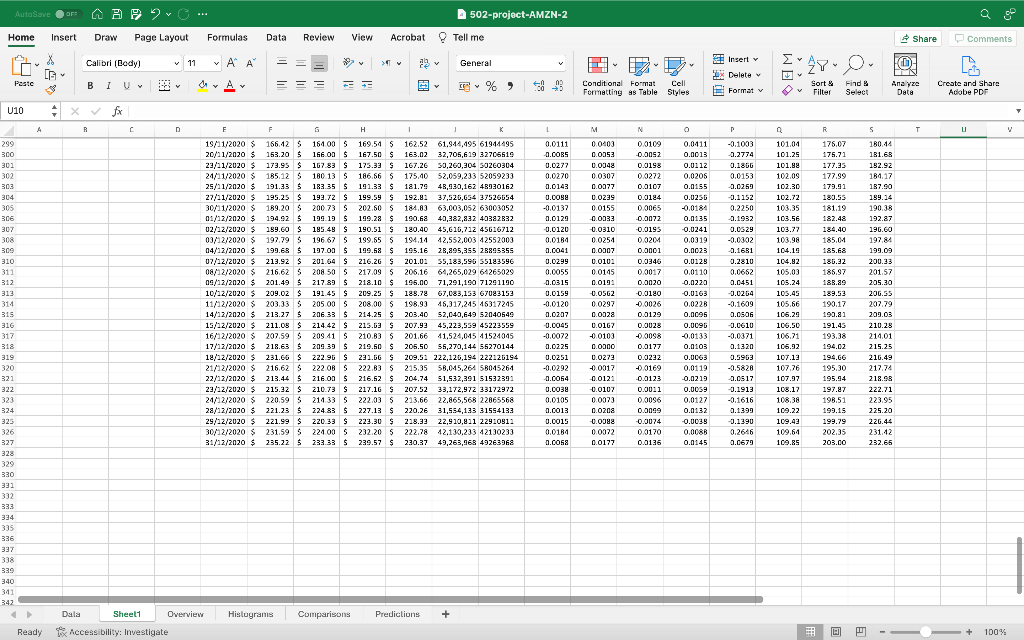
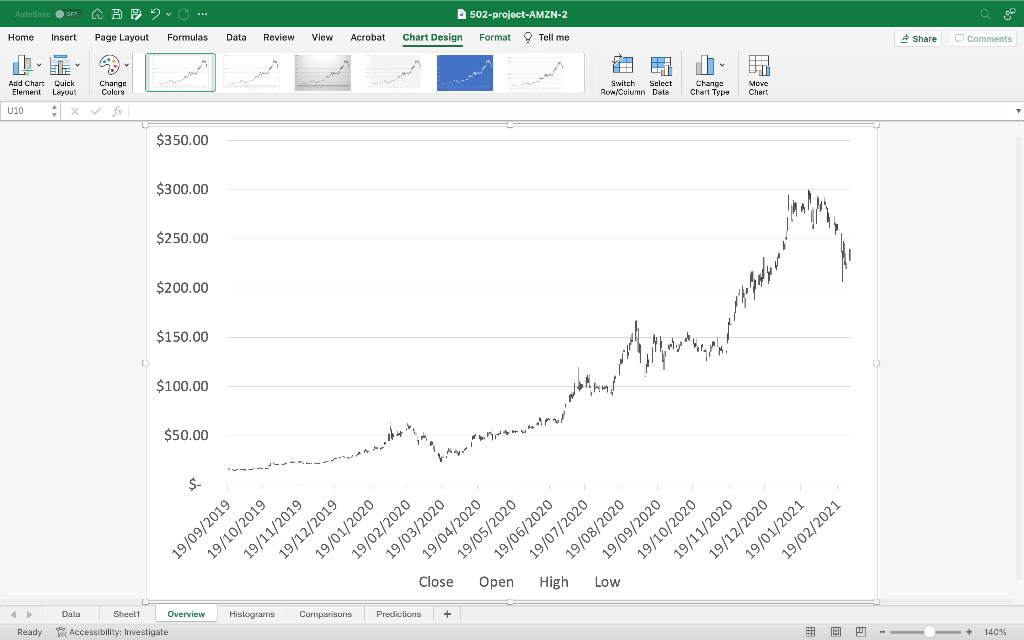
Question: Step 1. Using the Excel spreadsheet, acquire and visualize data for S&P500 and Dow-Jones indexes for the same year as chosen in Phase 1. Step
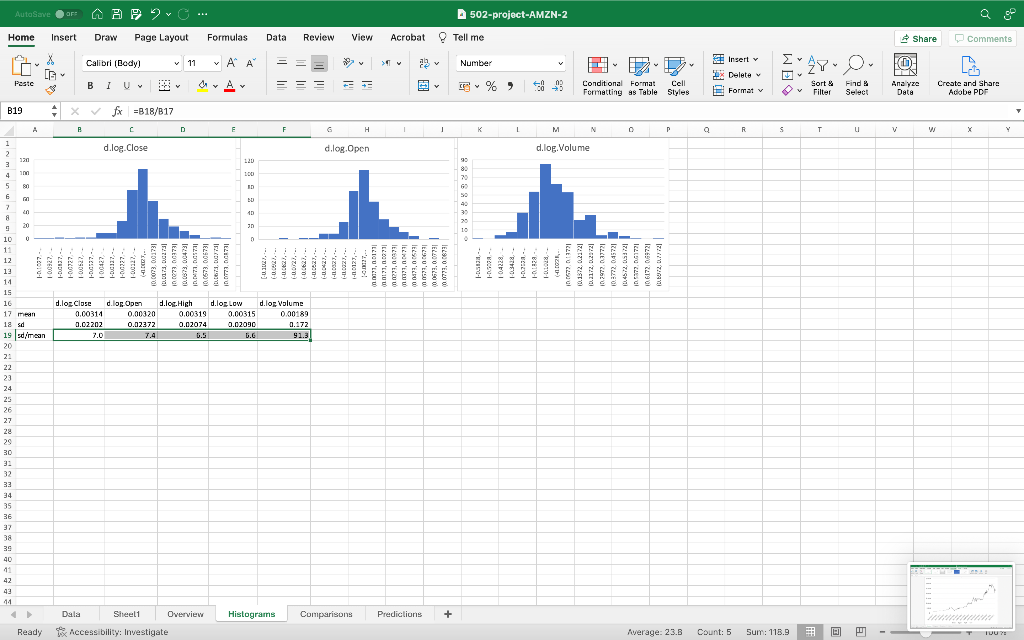
Step 1. Using the Excel spreadsheet, acquire and visualize data for S&P500 and Dow-Jones indexes for the same year as chosen in Phase 1. Step 2. What were the major events that have occurred in the stock market (for example, market rallies, market crashes, changes in government policies, economic situation)? Step 3. How did these major events reflect in the behavior of S&P500 and Dow-Jones indexes? Step 4. Write a 1000 to 1500 words report comparing the performance of S&P500, Dow-Jones and the company selected in Phase 1: 4.1 Which of the compared items exhibited higher volatility by comparing coefficient of variation (std/mean) of S&P500, Dow-Jones and company? Only one variable is sufficient, such as d.log.open. 4.2 Using the hypothesis test framework, calculate whether the differences in returns (mean) are
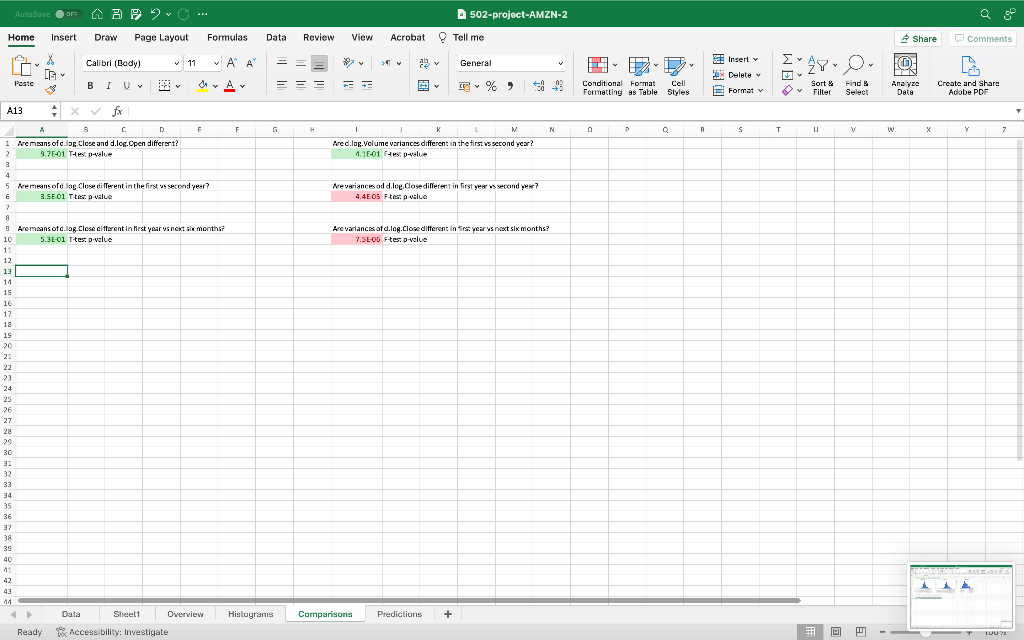
statistically significant 1 between S&P500 and Dow-Jones, and 2 between S&P500 and the company.
Hint: three T-test for S&P 500 and Dow-Jones, and three T-test for S&P500 and the company. (excluding the test using Volume as a variable) 4.3 Using the hypothesis test framework, calculate whether the differences in volatilities (variance) are
statistically significant 1 between S&P500 and Dow-Jones, and 2 between S&P500 and the company.
Hint: two F-test for S&P 500 and Dow-Jones, and two F-test for S&P and the company. (excluding the test using Volume as a variable)
Please arrange an appropriate structure in the report, at least including introduction, several middle sections (such as data collection and visualization, event behind data, analysis etc.) and conclusion.
Step by Step Solution
There are 3 Steps involved in it

Get step-by-step solutions from verified subject matter experts