

Question: Step 2, Question 2 If we use an = .05, using a t-table, what is the critical value for this question? Draw the t-critical distribution
Step 2, Question 2
If we use an = .05, using a t-table, what is the critical value for this question? Draw the t-critical distribution and put the critical value(s) and shade the critical region on the distribution.
A sample of n = 585 college students were selected to participate in the study. The mean score on the stress scale for the sample was M = 28.57 with SD = 2.518.
Research Question:
Did the participants in the study score significantly higher on the Stress Subscale pre-treatment than the normal population whose mean is = 18.08?
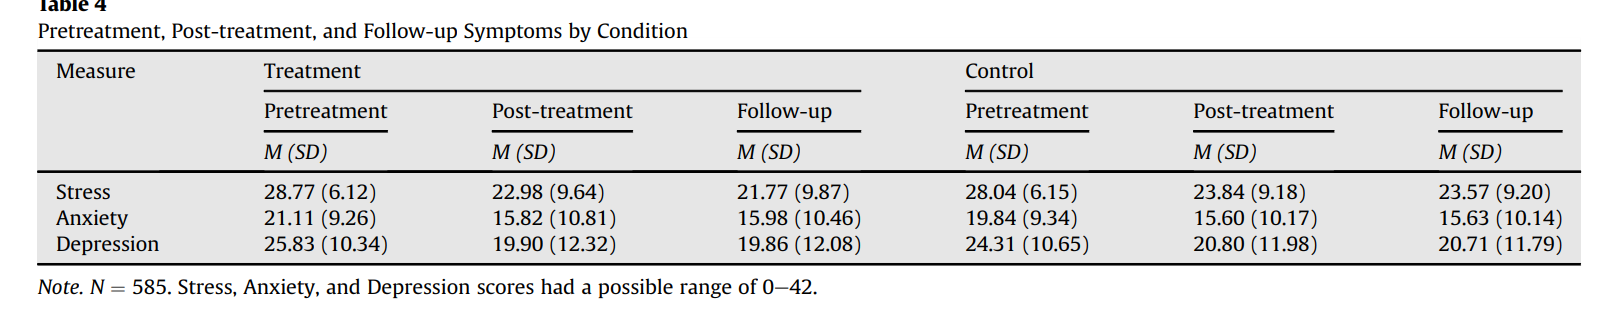
lable 4 Pretreatment, Post-treatment, and Follow-up Symptoms by Condition Measure Treatment Control Pretreatment Post-treatment Follow-up Pretreatment Post-treatment Follow-up M (SD) M (SD) M (SD) M (SD) M (SD) M (SD) Stress 28.77 (6.12) 22.98 (9.64) 21.77 (9.87) 28.04 (6.15) 23.84 (9.18) 23.57 (9.20) Anxiety 21.11 (9.26) 15.82 (10.81) 15.98 (10.46) 19.84 (9.34) 15.60 (10.17) 15.63 (10.14) Depression 25.83 (10.34) 19.90 (12.32) 19.86 (12.08) 24.31 (10.65) 20.80 (11.98) 20.71 (11.79) Note. N = 585. Stress, Anxiety, and Depression scores had a possible range of 0-42
Step by Step Solution
There are 3 Steps involved in it

Get step-by-step solutions from verified subject matter experts