

Question: Step 3 : Monitoring the process 5 . Subsequently, samples of 4 bottles were taken from the filling line. The fillings were measured, and the
Step : Monitoring the process
Subsequently, samples of bottles were taken from the filling line. The fillings were measured, and the following results were obtained. Use this data to check for process control. Is the process in control? Why?
tableSampleUnits,Sample stats,Hypothesis conclusionsXbar,RtableDecisionabout theXbar charttableDecisionabout the charttableDecision aboutthe processin control orout of control
Concepts:
What is the possible error type committed in drawing conclusions drawn for the samples?
Sample I:
Sample :
Sample :
What causes of variation common or assignable are present in the process now, after sample Based on your answer to # above.
What should the manager's next steps be
Page
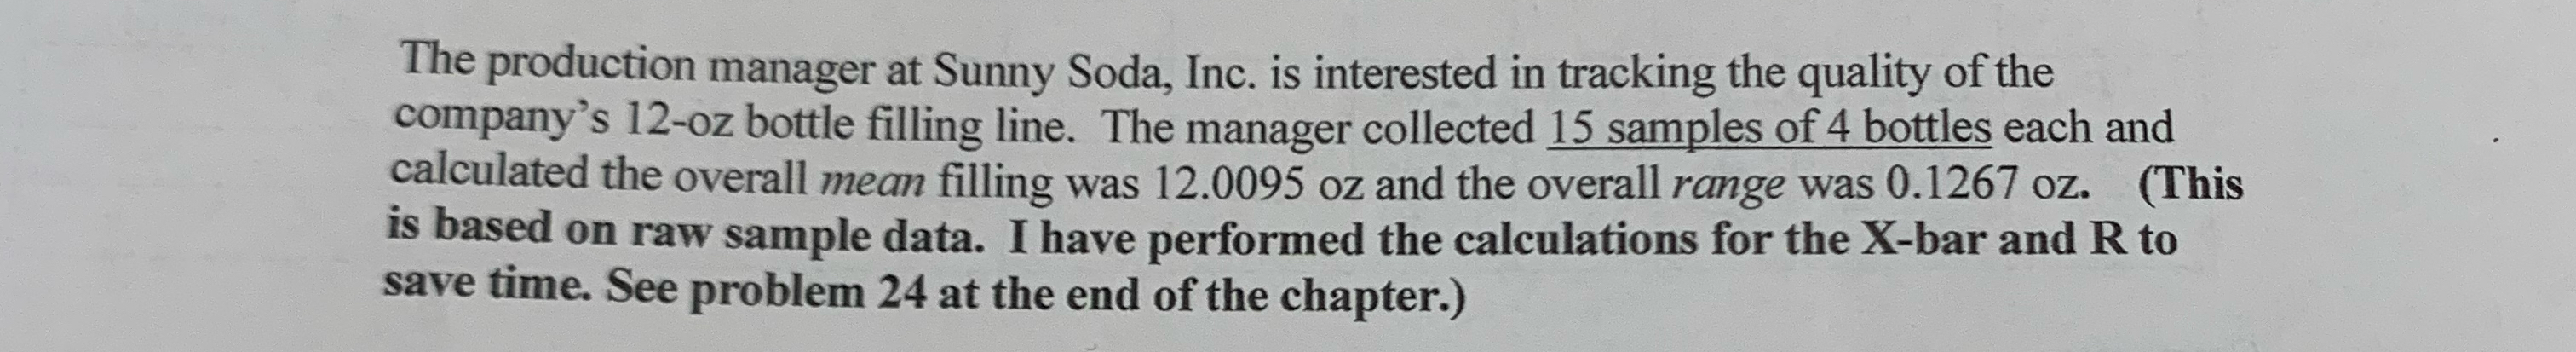
The production manager at Sunny Soda, Inc. is interested in tracking the quality of the company's bottle filling line. The manager collected samples of bottles each and calculated the overall mean filling was and the overall range was This is based on raw sample data. I have performed the calculations for the bar and to save time. See problem at the end of the chapter.
Step by Step Solution
There are 3 Steps involved in it
1 Expert Approved Answer
Step: 1 Unlock

Question Has Been Solved by an Expert!
Get step-by-step solutions from verified subject matter experts
Step: 2 Unlock
Step: 3 Unlock