Question: Step 3: Setting Direction 155 tude and heading will continue through the remainder of the flight. The three types of improvement are not strictly sequential.
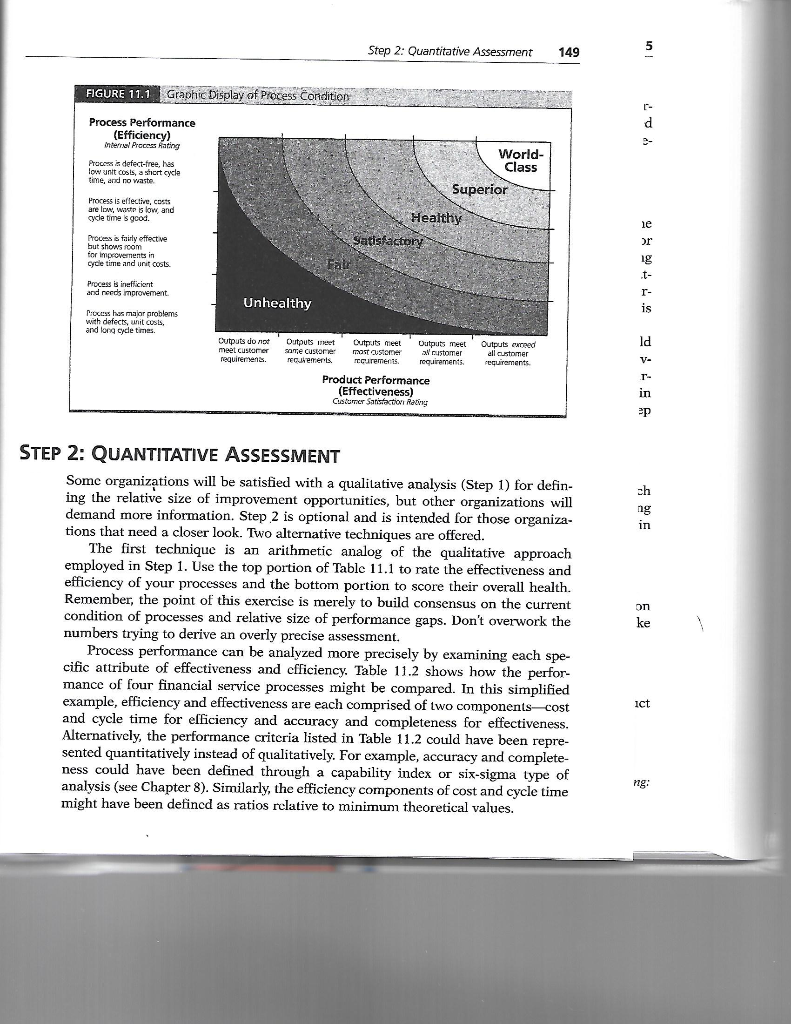
Step 3: Setting Direction 155 tude and heading will continue through the remainder of the flight. The three types of improvement are not strictly sequential. As with piloting an air- plane, the improvement of outputs, effectiveness, and efficiency should be viewed as a continuum of overlapping tasks. In most cases, product and process improve- ments will proceed concurrently. DIFFERENTIATE PRODUCT FROM PROCESS IMPROVEMENT Having completed an analysis of performance gaps, it is time to decide on the course of action and determine the type of improvement nccdcd. Do the goods or services delivered to the marketplace have sufficient acceptance to justify investing in the improvement of their production processes? Does analysis of customer sat- isfaction data offer sufficient encouragement on the viability of these goods or ser- vices? If not, efforts should focus on product improvement-a subject that is beyond the scope of this book. On the other hand, if the market appears to be viable, then priorities should focus on launching process improvement efforts. Projects might focus on improv- ing process effectiveness, efficiency, or both. As with adjusting the altitude of an air- craft, improvement of the underlying goods or services should continue in conjunction with the improvement of their production processes. Step-by-step guidance for improving processes begins in Chapter 12. SUMMARY The choice of improvement strategies is predicated on knowing the degree to which the process is efficient in the use of internal resources and effective in generating favorable outcomes. Without adequate assessment, subsequent investment in improvement projects could be a misuse of organizational resources. DISCUSSION QUESTIONS 1. Select a group of processes from the process inventory of your organization (Chapter 5), and compare their relative health by plotting them on a chart like Figure 11.1. 2. Based on your answer to question 1: a. Do any outputs or processes demand immediate improvement? b. What type of improvement is needed for those with the largest gaps-product or process? REFERENCES Leitnaker, M. G., Sanders, R. D., and Hild, Cheryl. 1995. The Power of Statistical Thinking: Improving Industrial Processes. Reading, MA: Addison-Wesley. Step 2: Quantitative Assessment 149 FIGURE 11.1 Graphic Display of Process Condition Process Performance (Efficiency) lerral Process Rating World- Class Procemi defect-free, has low unit costs, a short cycle time, and no waste Superior Process is effective, costs are low, waste is low and cetimes good Healthy Satisfactory from fairly effective but shows room for improvements in cycle time and unit costs Process inefficient and reeds mprovement Unhealthy Prochas maior problems with defects, it costs. and long cycle times. Outputs do not meet customer requirements Dutputs meet e custare FECereris Outputs Meet most customer ocurements Outputs Meet customer requirements Outputs were all customer requirements Product Performance (Effectiveness) Gastomer Satisfaction Rating ke STEP 2: QUANTITATIVE ASSESSMENT Some organizations will be satisfied with a qualitative analysis (Step 1) for defin- ing the relative size of improvement opportunities, but other organizations will demand more information. Step 2 is optional and is intended for those organiza- tions that need a closer look. Two alternative techniques are offered. The first technique is an arithmetic analog of the qualitative approach employed in Step 1. Use the top portion of Table 11.1 to rate the effectiveness and efficiency of your processes and the bottom portion to score their overall health. Remember, the point of this exercise is merely to build consensus on the current condition of processes and relative size of performance gaps. Don't overwork the numbers trying to derive an overly precise assessment. Process performance can be analyzed more precisely by examining each spe- cific attribute of effectiveness and cfficiency. Table 11.2 shows how the perfor- mance of four financial service processes might be compared. In this simplified example, efficiency and effectiveness are each comprised of two components cost and cycle time for efficiency and accuracy and completeness for effectiveness. Alternatively, the performance criteria listed in Table 11.2 could have been repre- sented quantitatively instead of qualitatively. For example, accuracy and complete- ness could have been defined through a capability index or six-sigma type of analysis (see Chapter 8). Similarly, the efficiency components of cost and cycle time might have been defined as ratios relative to minimum theoretical values. Step 3: Setting Direction 155 tude and heading will continue through the remainder of the flight. The three types of improvement are not strictly sequential. As with piloting an air- plane, the improvement of outputs, effectiveness, and efficiency should be viewed as a continuum of overlapping tasks. In most cases, product and process improve- ments will proceed concurrently. DIFFERENTIATE PRODUCT FROM PROCESS IMPROVEMENT Having completed an analysis of performance gaps, it is time to decide on the course of action and determine the type of improvement nccdcd. Do the goods or services delivered to the marketplace have sufficient acceptance to justify investing in the improvement of their production processes? Does analysis of customer sat- isfaction data offer sufficient encouragement on the viability of these goods or ser- vices? If not, efforts should focus on product improvement-a subject that is beyond the scope of this book. On the other hand, if the market appears to be viable, then priorities should focus on launching process improvement efforts. Projects might focus on improv- ing process effectiveness, efficiency, or both. As with adjusting the altitude of an air- craft, improvement of the underlying goods or services should continue in conjunction with the improvement of their production processes. Step-by-step guidance for improving processes begins in Chapter 12. SUMMARY The choice of improvement strategies is predicated on knowing the degree to which the process is efficient in the use of internal resources and effective in generating favorable outcomes. Without adequate assessment, subsequent investment in improvement projects could be a misuse of organizational resources. DISCUSSION QUESTIONS 1. Select a group of processes from the process inventory of your organization (Chapter 5), and compare their relative health by plotting them on a chart like Figure 11.1. 2. Based on your answer to question 1: a. Do any outputs or processes demand immediate improvement? b. What type of improvement is needed for those with the largest gaps-product or process? REFERENCES Leitnaker, M. G., Sanders, R. D., and Hild, Cheryl. 1995. The Power of Statistical Thinking: Improving Industrial Processes. Reading, MA: Addison-Wesley. Step 2: Quantitative Assessment 149 FIGURE 11.1 Graphic Display of Process Condition Process Performance (Efficiency) lerral Process Rating World- Class Procemi defect-free, has low unit costs, a short cycle time, and no waste Superior Process is effective, costs are low, waste is low and cetimes good Healthy Satisfactory from fairly effective but shows room for improvements in cycle time and unit costs Process inefficient and reeds mprovement Unhealthy Prochas maior problems with defects, it costs. and long cycle times. Outputs do not meet customer requirements Dutputs meet e custare FECereris Outputs Meet most customer ocurements Outputs Meet customer requirements Outputs were all customer requirements Product Performance (Effectiveness) Gastomer Satisfaction Rating ke STEP 2: QUANTITATIVE ASSESSMENT Some organizations will be satisfied with a qualitative analysis (Step 1) for defin- ing the relative size of improvement opportunities, but other organizations will demand more information. Step 2 is optional and is intended for those organiza- tions that need a closer look. Two alternative techniques are offered. The first technique is an arithmetic analog of the qualitative approach employed in Step 1. Use the top portion of Table 11.1 to rate the effectiveness and efficiency of your processes and the bottom portion to score their overall health. Remember, the point of this exercise is merely to build consensus on the current condition of processes and relative size of performance gaps. Don't overwork the numbers trying to derive an overly precise assessment. Process performance can be analyzed more precisely by examining each spe- cific attribute of effectiveness and cfficiency. Table 11.2 shows how the perfor- mance of four financial service processes might be compared. In this simplified example, efficiency and effectiveness are each comprised of two components cost and cycle time for efficiency and accuracy and completeness for effectiveness. Alternatively, the performance criteria listed in Table 11.2 could have been repre- sented quantitatively instead of qualitatively. For example, accuracy and complete- ness could have been defined through a capability index or six-sigma type of analysis (see Chapter 8). Similarly, the efficiency components of cost and cycle time might have been defined as ratios relative to minimum theoretical values


